STS Developers Kit: A Bright Future
The STS spectrometer was created to take spectroscopy one step further into the field with its compact size and low power consumption. It’s been doing exactly that in remote sensing applications for agriculture, the environment and life sciences, all of which benefit from the rugged design and thermal stability of the STS. We’ve seen the spectrometer used to measure the faint glow of chlorophyll fluorescence from plants, and learned that it is involved in studies to understand how photosynthetic patterns of different tropical tree species change with short-term climatic variation. It’s even been mounted on an unmanned aerial vehicle (UAV) to monitor the health of crops .
On the other end of the spectrum, STS spectrometers are finding their way into smaller spaces in industry, enabled by the ability to transmit data wirelessly and perform computing in the cloud:
- Radioactive reactor chambers, measuring plasma emissions without the expense of vacuum feedthroughs
- Wireless handheld systems, for the measurement of emissive color from screens and displays
- Monitoring systems, in which absorbance measurements facilitate production process control
- Diagnostic systems, employed in smart greenhouses to measure PAR via reflectance spectroscopy
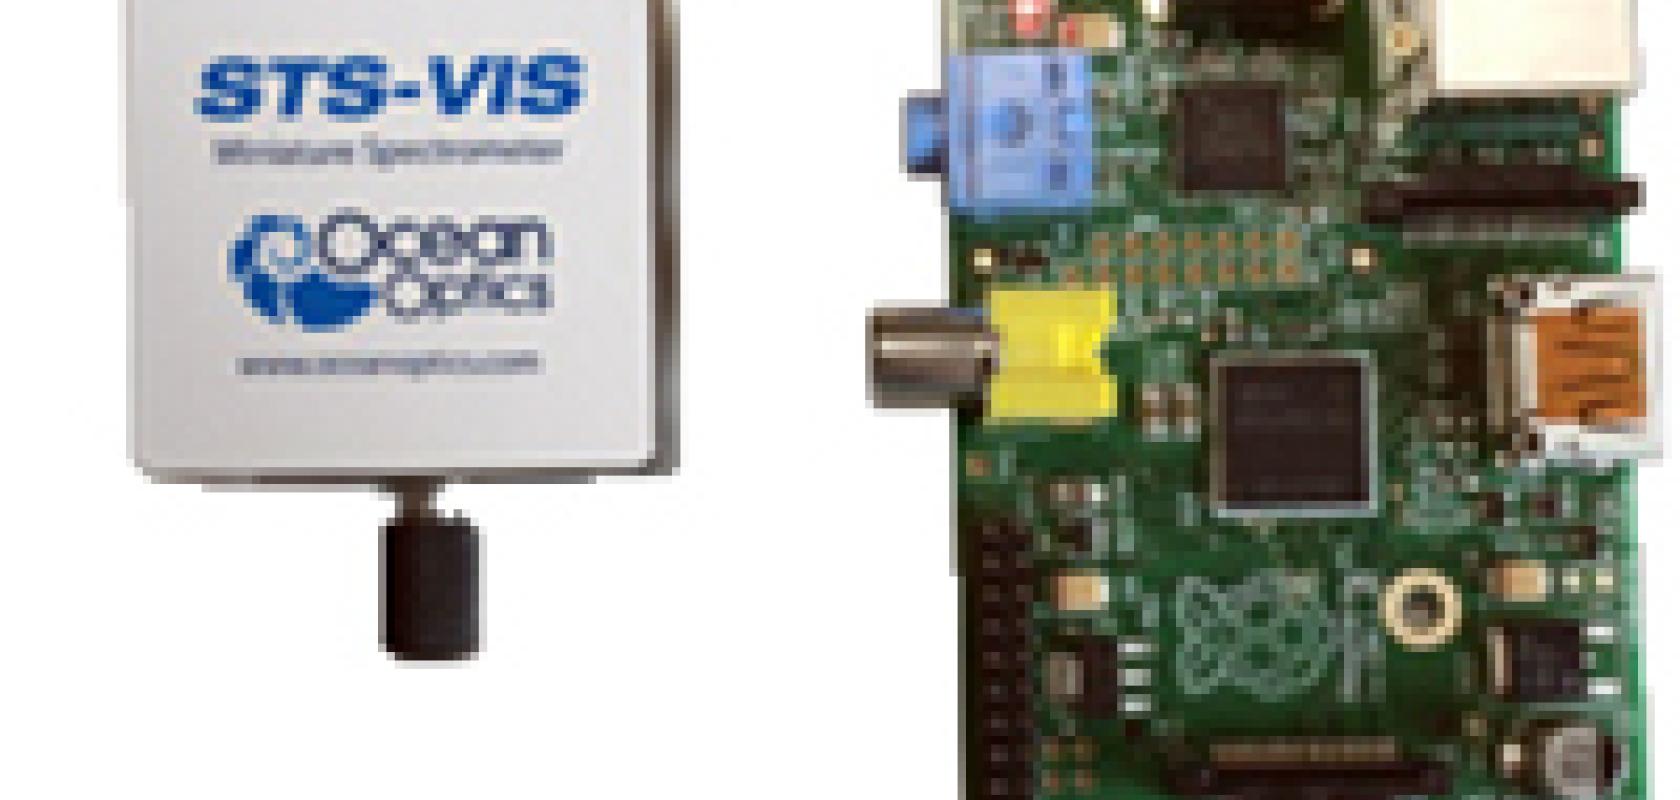
A number of these users have benefited from our versatile STS Developers Kit, which combines the versatile STS spectrometer with a Raspberry Pi microcomputer, Wi-Fi, battery and customizable software. The addition of processing power and wireless capabilities to the STS spectrometer at minimal additional cost not only speeds the development process, but offers more options for remote control of the spectrometer via phone, tablet or computer web browser. The STS Developers Kit is also attractive for education at the university level, giving students a chance to simulate the product development process in the classroom with a spectrometer actually used by OEMs in markets ranging from food safety to projection display systems. Not only do students get hands on with the experiment, but they have the opportunity to connect science, spectroscopy and basic programming skills in an engaging and applicable way.
The Challenge: Create a “Product”
We challenged one of our application scientists, Miriam Mowat, to create a “product” of her own with the STS Developers Kit – one that could be replicated in the educational lab or find use in industry. The STS Developers Kit can be used out of the box with the default software, or a custom application can be created using the accessible PHP scripting language; we were curious to see which route she would choose. Despite never having used the Developers Kit, she rose to the task and returned just three weeks later with the completed project, data and code you can download for use yourself!
Since many of the recent field applications of the STS have been in the areas of emission measurements and remote monitoring, she decided to create a wireless UV monitoring station. Solar UV radiation measurements are relevant both for health reasons and in environmental science. Public concern over the health impact of UV exposure has increased in the last 30 years, a result of changing lifestyles and awareness of depletion of the ozone layer. Irradiance spectroscopy is an effective method for accurately measuring solar UV radiation, and the STS-UV a natural choice for creating a UV index monitor.
Miriam used the Ocean Optics STS Developers Kit used to implement direct measurement of local UV index similar to real world ground stations, delivering accurate, reliable and real time data. The self-contained performed all calculations on-board, storing data on the Raspberry Pi microcomputer. The data was transferred back to the host computer or network via the standard Wi-Fi connection with up to 150 m of range. The PHP script used to perform the calculations was written so as to also plot live data in a web browser interface, allowing results to be observed in real time.
What is the UV Index, and Why Is It Important?
The UV index is the measure of skin-damaging ultraviolet radiation at a particular location and time, distilled down to a single number. The amount and distribution of solar UV radiation can be affected by levels of cloud cover and air pollution as well as the time of year, location, and altitude. Ground based reflection (known as albedo) can have a strong effect on UV index, as in the presence of sand or snow, as can the presence and quantity of attenuating particles in the atmosphere, including ozone.

Solar UV radiation is divided into categories based on wavelength, corresponding to the relative harmfulness of the radiation to skin. UVC is the most damaging due to the high energy of its short wavelengths, yet little reaches the ground thanks to strong absorption by the upper and middle atmosphere. UVB is also heavily absorbed and makes up between 0.5-5% of UV radiation reaching the ground level, while the remainder is UVA. UVB radiation is responsible for most of the effects we see from solar radiation, including sunburn, tanning and vitamin D3 production. It is also strongly associated with skin cancer1. UVA is the cause of immediate but non-lasting reddening of the skin, and results in less cancer-causing damage to DNA. However, since most UV radiation reaching us is UVA, it is still a contributing factor in skin cancer. Spectroscopy has facilitated studies of the impact of different wavelengths on cells, and offers us a way to monitor and understand the impact of solar irradiation on cancer risks.

The UV index often quoted in weather forecasts is a scale from 1 to 10+ to indicate potential damage to skin for a given location and time2. It is calculated by integrating the solar radiation spectrum over wavelength with a weighting function known as the erythemal function. The erythemal function is a measure of the ability of ultraviolet radiation to produce just perceptible erythema, or reddening, of the skin. It is the outcome of various works on skin damage of UV radiation3, and has become an official standard used by the CIE (International Commission on Illumination). The UV index is most often derived by meteorologists using satellite data, and is specific to the location, date and time. More accurate measurements use ground stations, which can be built using modular, miniature spectrometers.

Creating a UV Index Monitor
The UV index monitor was created using the hardware available with the STS Developers Kit, a600 µm UV/VIS fiber and a CC-3-UV-S cosine corrector. The cosine corrector was chosen in order to collect light from a 180° field of view, representative of sunlight incident at ground level. The STS-UV version of the kit was used to provide data from 190 – 650 nm, corresponding to the relevant portions of the UV spectrum.
A web scripting API (application programming interface) known as PHP provided with the kit was used to program data acquisition, analysis, and display on a remote webpage. PHP is a widely-used, open source scripting language in which scripts are executed on the server. It is simple enough for beginner programmers to use, and complex enough to run complex applications like WordPress for blogging and Facebook. PHP also runs on various platforms (Windows, Linux, Unix, Mac OS X, etc.), is compatible with almost all servers (Apache, IIS, etc.), and supports a wide range of databases.
To calculate the UV index from raw irradiance spectra, the spectrum was first calibrated to give a measurement of absolute irradiance. This was performed using an Ocean Optics DH-3 calibration light sourceto create a calibration file for the spectrometer. The calibration file was then included in the algorithm as an array multiplication, adjusting for integration time and units. The spectrum was multiplied by the erythemal function, w(λ), as follows4:

The calibration and the erythemal function can be found in the code file titled UVweighting.txt. All code and files are included at the project download link found at the end.

Figure 1 – The CIE (1987) reference action spectrum for erythema in human skin. Source: TEMIS website5
Once the spectrum has been weighted and calibrated, the next step is to perform an integration. This can be found in the code file titled UVindex.txt. Here, a trapezium rule style integration was used as the simplest way to estimate an integration. Following this, the value was adjusted for units and multiplied by a factor of 4, as part of the definition of UV index puts it in a scale of 1-10 corresponding to 0.25 W m2 (or 25 µW cm2) of erythemally weighted UV radiation4.
This is shown in the two following equations4:

where I(λ) is the absolute irradiance in W/m2 (or µW/cm2), w(λ) is the erythemal function shown above, UVEry is the erythemally weighted UV spectrum, and UVI is the UV index.
Remote Display of UV Index
Once calculated, the spectra and UV index could be displayed on a webpage on a remote computer. The Raspberry Pi was connected via Wi-Fi to update every minute, each time taking a measurement and displaying the results live.
(a)

(b)

(c)
Figure 2 – Webpage display spectra produced by the Raspberry Pi: (a) raw spectrum data, (b) calibrated spectrum, (c) erythemally weighted spectrum.
Spectra shown include the raw spectrum, the calibrated absolute irradiance spectrum, and the erythemally weighted spectrum. The UV index calculated based on the erythemally weighted spectrum was also displayed. All graph drawing functionality was developed using PHP scripting, and can be found in the downloadable code.
To take system development one step further, a time series graph of the UV index was plotted over several hours. Each measurement was saved onto the Raspberry Pi by the algorithm, and then input into a new graph. The results are shown below, in Figure 3 and Figure 4.

Figure 3 – UV index over time measured using the STS UV Live Monitor in 60s intervals: July 30th, Oxford, UK

Figure 4 – UV index over time measured using the STS UV Live Monitor in 60s intervals: July 31st, Oxford, UK
The data shown was taken on a semi-cloudy summer’s day in Oxford, UK. Morning measurements saw the day clear with steadily increasing UV index, with patchy cloud movement later in the day causing considerable variation.
Summary
This project saw the STS Developers Kit used to build a UV Live Monitor capable of collecting and converting absolute irradiance spectral measurements into UV index values reported live via web throughout the day. The compact modularity of this system would allow it to be transported anywhere for accurately measuring UV radiation levels.
The low cost and flexibility demonstrated by the STS Developers Kit is equally well suited to education, research, and new product development, as custom applications can be created quickly, easily and anywhere.
How was the development experience for our applications engineer? “As someone with minor programming experience, using the dev kit for this project required learning along the way. PHP was not a language I had used before, but it was easy to learn and implement,” said Miriam.
Using just a basic level of coding and a bit of imagination, the possibilities are limitless with the STS Developers Kit. Find all of the documentation needed to begin using the STS Developers Kit.
References
1 “UV Radiation.” World Health Organization. N.p., n.d. Web. 19 Aug. 2015. .
2 “UV Index.” Met Office. N.p., n.d. Web. 19 Aug. 2015. .
3 McKinlay, A. F., and B. L. Diffey. “A reference action spectrum for ultraviolet induced erythema in human skin.” CIE j 6.1 (1987): 17-22.
4 McKenzie, Richard, Dan Smale, and Michael Kotkamp. “Relationship between UVB and erythemally weighted radiation.” Photochemical & Photobiological Sciences 3.3 (2004): 252-256.
5 “UV Radiation Monitoring: UV Index and UV Dose.” TEMIS. N.p., n.d. Web. 19 Aug. 2015. .
6 Price, Luke L. A., Rebecca J. Hooke, and Marina Khazova. “Effects of ambient temperature on the performance of CCD array spectroradiometers and practical implications for field measurements.” Journal of Radiological Protection 34.3 (2014): 655.
