When we were all cooped up during Covid-19 lockdowns in 2020, good news was hard to find. But among the heartbreaking stories of loved ones lost and health systems strained to breaking point, a glimmer of positivity was provided by the European Space Agency (ESA). Wielding data from their Copernicus Sentinel-5P satellite, the ESA produced a set of animations showing how lockdown had dramatically reduced air pollution, most strikingly by about 40% across China.
Though such a drop-off in emissions was to be expected, visual confirmation brought home the fact that we, as a global society, can make a significant and measurable impact on the air we breathe and the climate we live in.
A year later, Sentinel-5P data showed nitrogen dioxide levels bounced back to pre-Covid levels, hammering home the urgency of this point.
Insights from space
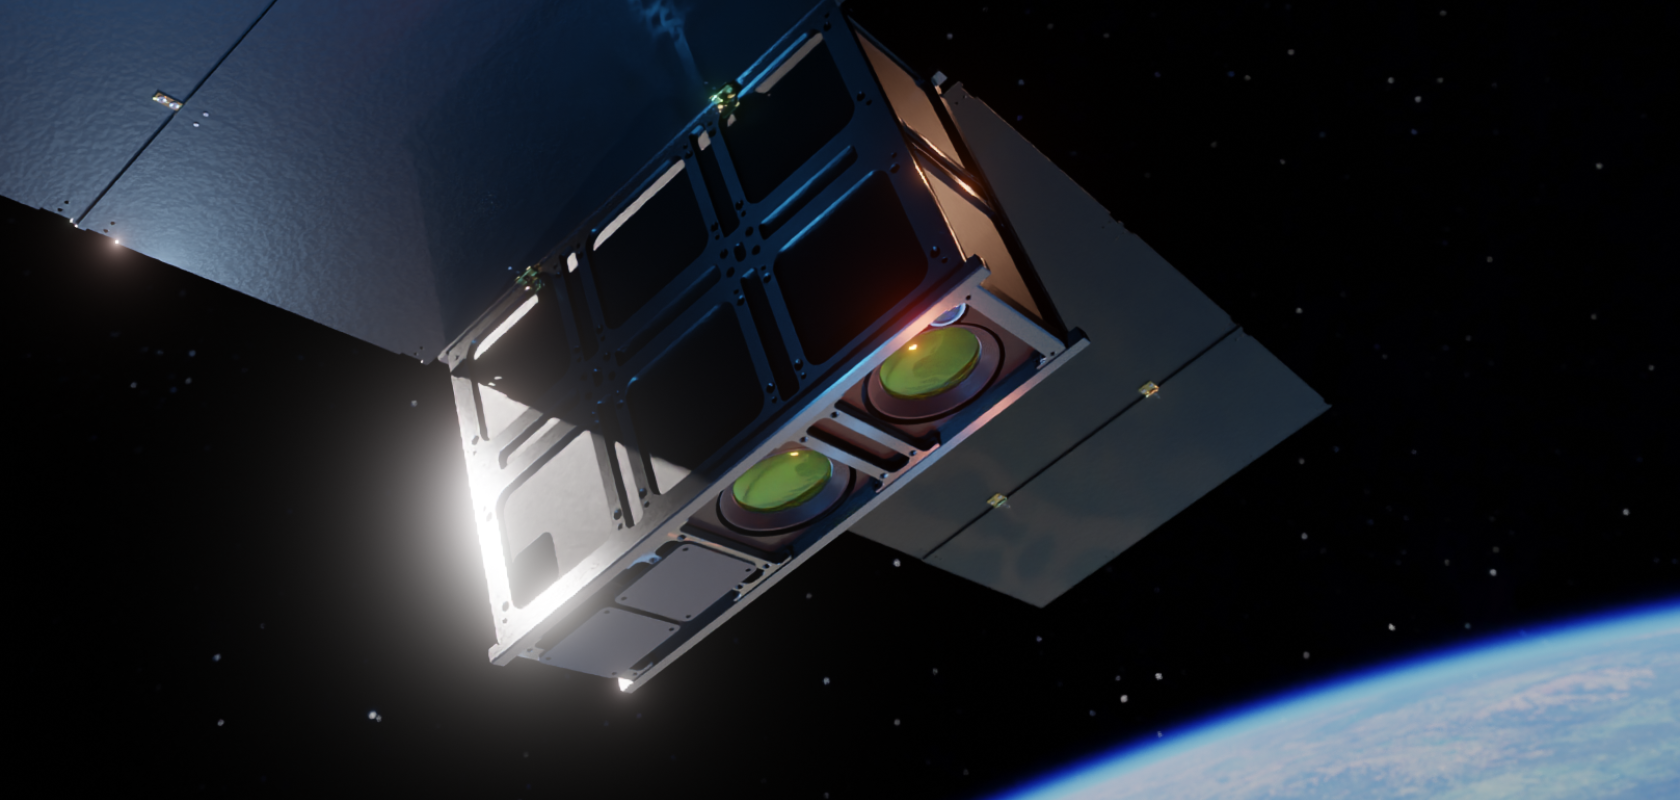
Launched on 13 October 2017, Sentinel-5P carries a single instrument, the four-band passive grating spectrometer TROPOspheric Monitoring Instrument (TROPOMI). Covering the wavelength range between ultraviolet and shortwave infrared, TROPOMI compares sunlight measured in space with light reflected back from Earth to calculate how certain concentrations of gases – such as ozone, nitrogen oxides and methane – develop in the atmosphere. It operates in a push-broom configuration (non-scanning) in nadir viewing, with a swath width of about 2,600 km on the Earth's surface, producing a typical pixel size of 7 x 3.5 km2. These characteristics make TROPOMI the most advanced multispectral imaging spectrometer ever flown, capable of monitoring atmospheric gases that indicate the level of industrial activity happening across the world, and how well or badly humanity is doing in curbing its emissions globally.
TROPOMI innovative optical design allows it to achieve unsurpassed performance in terms of sensitivity, spectral resolution, spatial resolution and temporal resolution in a compact device. For example, freeform optics techniques were used to produce two freeform mirrors that provide the instrument’s extremely wide 108° field of view. In addition, immersed diffraction grating technology was developed specifically for TROPOMI’s shortwave infrared spectrometer. Immersion means that diffraction takes place inside a silicon prism with a grating surface etched onto one face. Silicon’s high refractive index boosts resolution and dispersion, and the prism provides fine alignment adjustment. Together, these features led to a huge reduction in spectrometer volume.
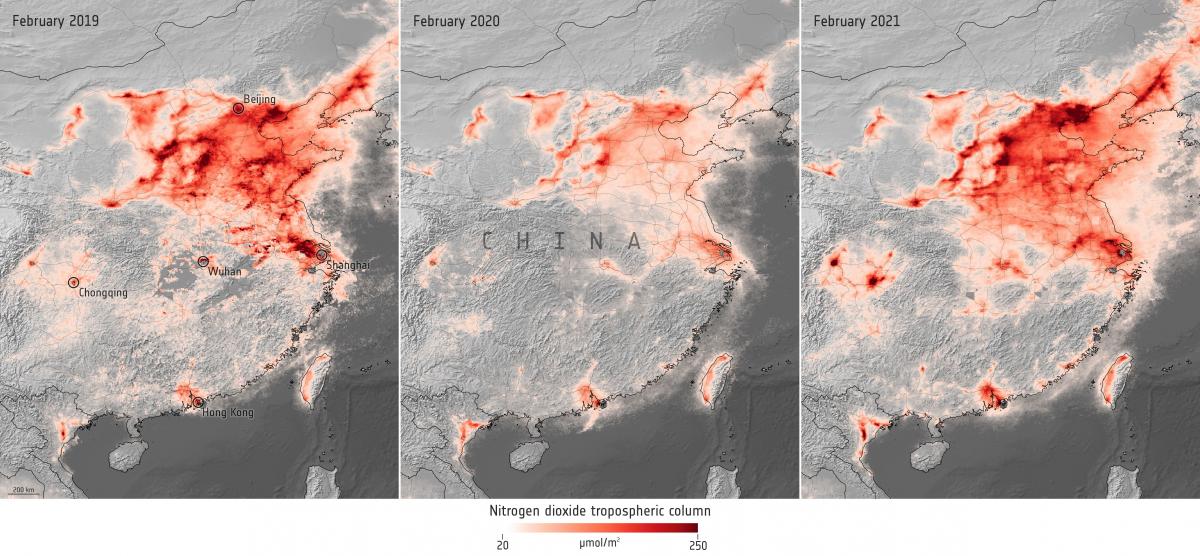
Imagery from the ESA’s Copernicus Sentinel-5P satellite clearly show the impact of lockdown on NO2 air pollution in China
Another innovative climate monitoring satellite is NASA’s Ice, Cloud, and land Elevation Satellite-2 (ICESat-2). Launched on 15 September 2018, ICESat-2 also carries just one instrument, the Advanced Topographic Laser Altimeter System (ATLAS). An Earth-scanning lidar, ATLAS’ diode-pumped solid-state laser sends a single ~450 µJ beam through a diffractive optical element that splits it into three 120 µJ and three 30 µJ pulses. 10,000 pulses are sent down to Earth every second, some of which bounce back and are recorded by a photon-counting laser altimeter that allows scientists to measure the elevation of glaciers, sea ice, forests and more every 0.7m along-track.
ATLAS uses photomultiplier tubes (PMTs) as detectors in photon-counting mode, so that a single photon reflected back to the receiver triggers a detection. But when ATLAS was in development, the only space-rated PMTs available operated at vivid green 532nm wavelength, which Science Team Leader Lori Magruder (University of Texas at Austin) recalls caused a lot of worry. “Vegetation is not as reflective to green laser energy as it is to infrared, so many were concerned that it would be difficult to retrieve canopy and terrain heights without aggregating over long length scales,” she says. “Additionally, there was concern that the heights measured over snow- or ice-covered surfaces would have additional uncertainties due to laser penetration.”
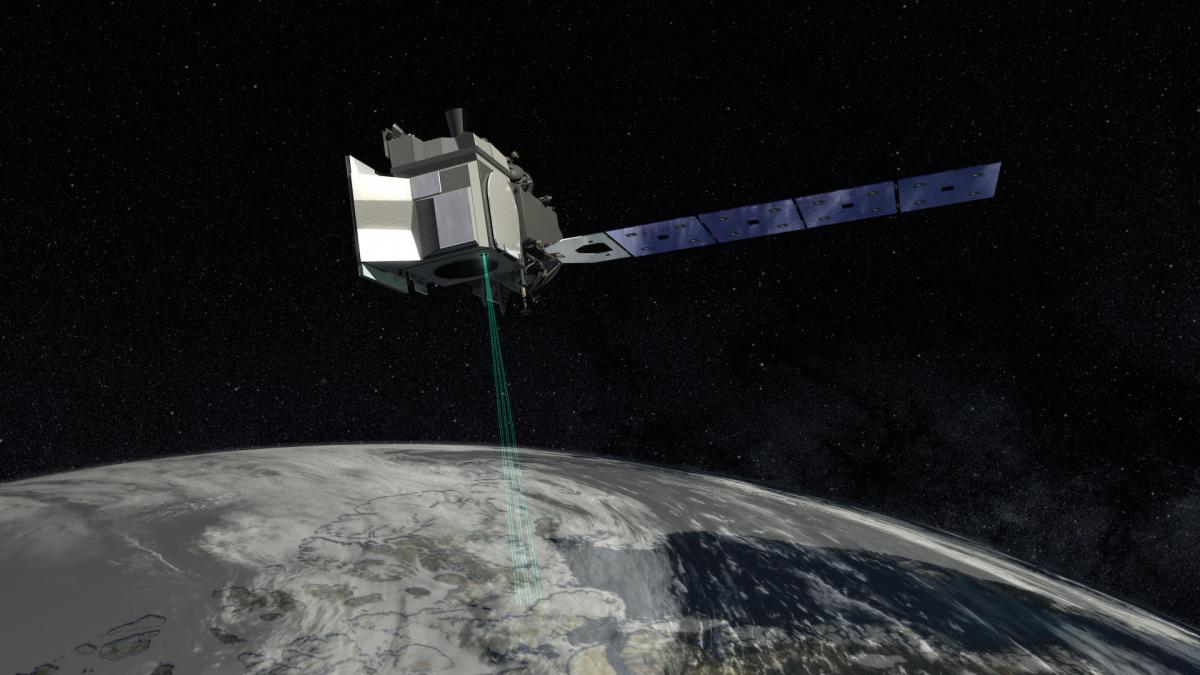
Atlas detects individual photons, allowing scientists to measure the elevation of ice sheets, sea ice, forests and more in unprecedented detail
These concerns were unfounded. ICESat-2 produces detailed biomass maps, accurate ice sheet elevation measurements and even exhibited a new capability not part of the mission aims: “The fact that 532nm can penetrate water has become one of the most transformational capabilities of the satellite,” says Magruder. “Being able to measure the seafloor at depths up to 50m from 500km in space has created a global measuring stick for nearshore bathymetry.”
ICESat-2 has already produced unique and critical science data to monitor climate change and is likely to continue to do so well past its nominal mission lifetime of three years (which it has already surpassed). “I think one of the most amazing technology realisations of ATLAS is the stability of the laser – after four years and 1.3 trillion shots, the laser has lost just about 10% of the energy at the current setting, which was recovered by boosting the setting last September,” says Magruder. “The mission could last until 2037 based on fuel constraints – the laser will not be the limiting factor.”
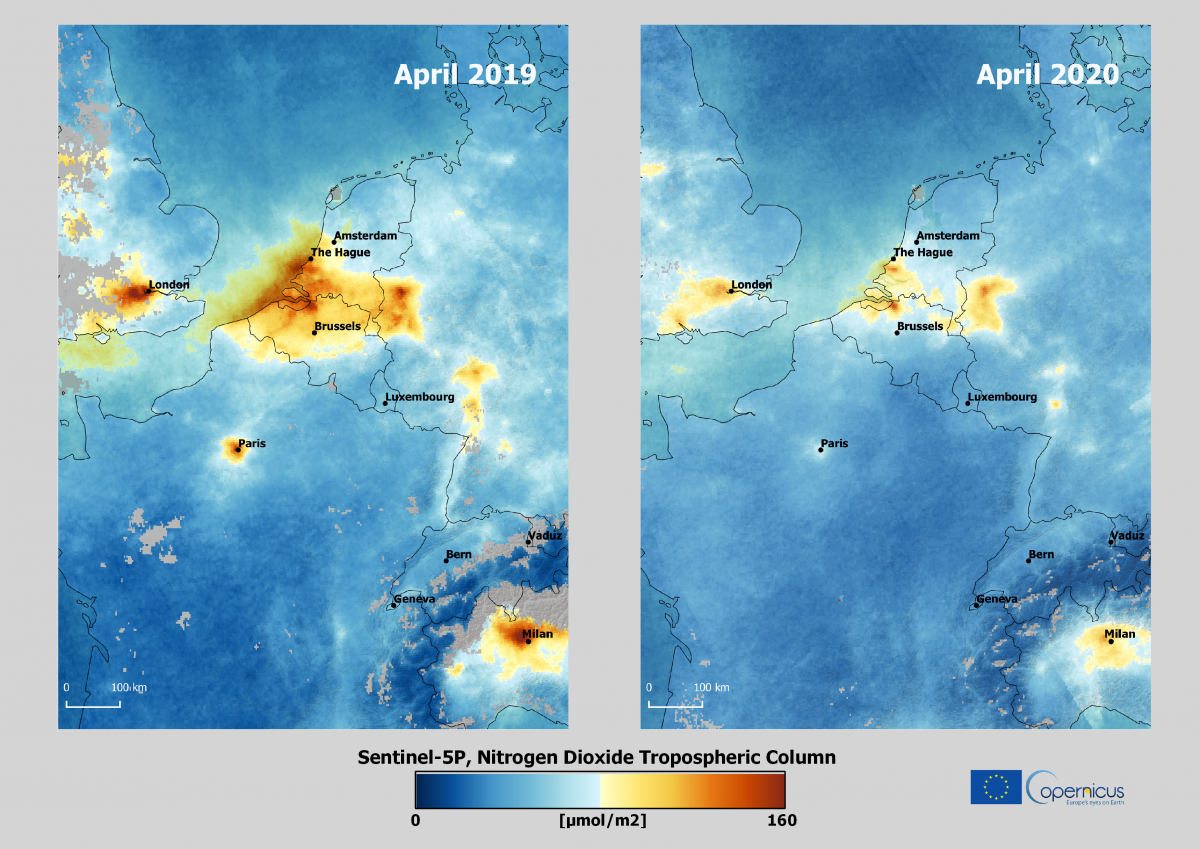
Sentinel-5P’s images also show the effect of lockdown on NO2 over Europe
Commercial climate monitoring from above
Space agencies are not the only organisations monitoring climate indicators from space. For example, some companies are exploiting satellite imagery to detect and stamp out wildfires before they cause widespread devastation and release millions of tonnes of CO2 into the atmosphere. A primary emission source and indicator of climate change, recent years have seen unprecedented wildfires cause havoc across the world, from the Arctic to the Amazon. With wildfires contributing 5-10% of annual global CO2 emissions, more frequent and intense blazes due to climate change have a feedback effect, where the results of warming produce yet more warming.
Based in Australia, exci monitors high-risk/high-value forested areas via a combination of ground-based camera networks (camera-agnostic) and Earth-observing satellites. Data is collated and processed by sophisticated algorithms that detect fire signatures, such as smoke and heat. When a fire is spotted, reports are immediately presented to the relevant users. Exci takes data from US polar-orbiting satellites NOAA-20, Terra, Aqua and Suomi NPP. But given these satellites only revisit Australia twice a day, they rarely spot a nascent fire when passing over. This is why the exci team uses data from the Japanese Himawari 8 (launched 7 October 2014), a weather satellite positioned in geostationary orbit over the Asia-Pacific region. Himawari 8 features a 16-channel multispectral imager to capture visible light and infrared images with a resolution down to 500m.
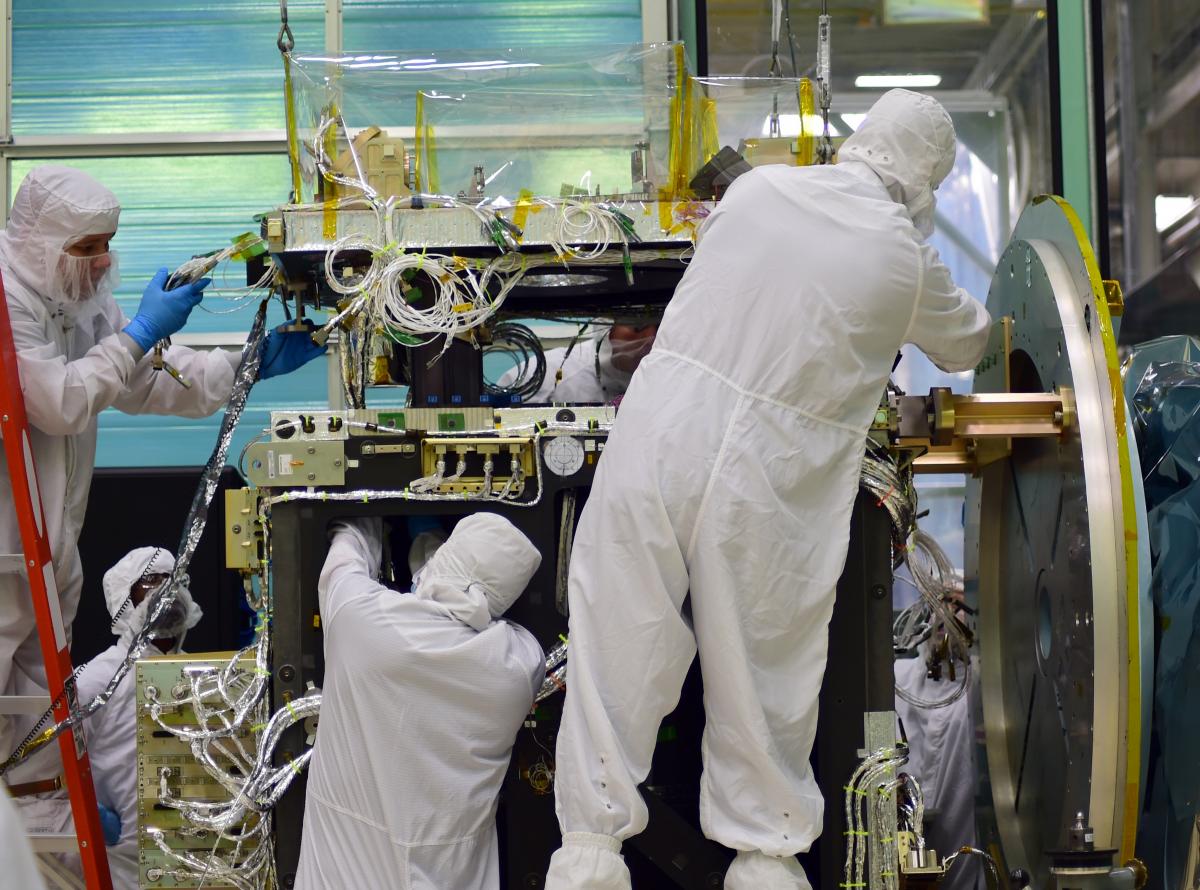
Engineers build and test the Advanced Topographic Laser Altimeter System (Atlas) for the ICESat-2 mission at Nasa’s Goddard Space Flight Center in Greenbelt
Why does exci not rely solely on Himawari 8 fire warnings? It comes down to data processing time. “A full scan of the coverage area is taken every 10 minutes,” says exci COO Gabrielle Tylor. “But processing the data can take up to 25 minutes.” Tylor says early detection of wildfires within minutes after ignition by using current satellite technology alone is not possible. Nevertheless, exci’s proprietary algorithms enable wildfire detection from space on average in between 10 and 20 minutes over a given area. When this is combined with ground-based camera data, trials in California showed the system could detect 66% of fires within a minute, 95% within 5 minutes, and nearly 100% within 10 minutes, with a near-zero rate of false positives.
German company OroraTech has the same ambition as exci, but is approaching the inadequacies of current satellite coverage and data latency in a different way. The company’s first nanosatellite, FOREST-1, launched in January 2022. It plans to launch the next eight satellites in 2023-24 and up to a total of 100 in subsequent years. The idea is to improve coverage by satellites in low earth orbit in the afternoon, which is the peak time for wildfires. “At those times, we want to get a very, very quick revisit of our satellites, enabling rapid response of the fire brigade,” says OroraTech Head of Payload Engineering Lucas Krempel. “With a full constellation, we aim for a 30-minute response to a fire of 10 x 10 m2 anywhere in the world.”
FOREST-1 carries a thermal infrared detector with mid- and longwave infrared filters that requires no cryo-cooling, allowing the entire system to fit in a footprint the size of a shoebox. Given the system is not cooled, to combat noise FOREST-1 has a large aperture and broadband system to funnel as much light as possible into the detector. The resulting 250m thermal infrared resolution in FOREST-1 (and 200m resolution in subsequent FOREST nanosatellites) is more than sufficient to detect fires soon after they ignite.
To combat data latency, OroraTech has chosen to fly a dedicated graphics card onboard to process and condense data in situ. “And then we have an inter-satellite link system that we've developed that is like sending a small SMS with information about an identified wildfire to other satellites in space,” explains Krempel. “The idea is that with the full constellation it will take only a couple of minutes from having the satellite flown over the region to the fire brigade having the alert on their system.”
Monitoring from the air
Though satellites packed with photonics technologies are crucial in quantifying climate change and thereby helping in efforts to mitigate its impacts, there are some jobs that are best done closer to home. One of the most innovative of these efforts from a photonics perspective has been in developing optics specifically to monitor the ‘rainforests of the sea’ – coral reefs.
The Coral Reef Airborne Laboratory (CORAL) project was a NASA Jet Propulsion Laboratory project to develop an innovative hyperspectral imaging system, the Portable Remote Imaging Spectrometer (PRISM), and fly it aboard a Gulfstream IV jet above portions of the world’s coral reefs. In 2016 and 2017, PRISM flew over reefs performing push-broom scanning at 350 to 1,050nm, with spectral sampling of 3nm and a 30-degree field of view. It combined this with a two-channel spot radiometer operating at 1,240nm and 1,640nm for accurate atmospheric and ocean colour correction, yielding a resolution of 10m per pixel. The result was the largest survey of the condition of the world's coral reefs that had ever been undertaken, pointing to why and how reefs change in response to climate change.
More recently, US researchers mapped a coral reef before and after a major marine heatwave in the Hawaiian Islands using the Global Airborne Observatory (GAO), a highly modified Dornier 228-202 aircraft. Using GAO’s high-fidelity imaging spectrometer (427 channels from ultraviolet through to shortwave infrared) and a lidar scanner (pulse frequency 200kHz, scan frequency 34Hz, with a 38-degree field of view), the researchers achieved 2m spatial resolution down to a depth of 16m. In addition, the aircraft’s 60-megapixel digital mapping camera was used to assess and manage confounding sea surface glint levels. Combining these datasets produced results that highlighted resilient corals and clement reef environments that can now be used for targeted conservation efforts in a changing climate.
Ground truth
The measurement and monitoring of changes in ocean temperature, salinity, sea-ice cover, surface temperature, precipitation and atmospheric composition have been conducted by ground-based climate measurement at numerous points across the globe for decades. This has been achieved using a multitude of techniques including sonde, lidar, radiometers and various spectrometers.
The problem with all of these techniques is that they only monitor climate locally around their associated ground station or at the surface. There is a new method that has no such limitation: distributed optic fibre sensing.
“Optical fibres are good at measuring two quantities: strain and temperature,” says Gilberto Brambilla, of the University of Southampton. “If you can measure strain over time, you can measure vibrations and sound, and you effectively have an artificial ear located along the fibre.”
Brambilla’s colleague Ali Masoudi explains that the technique – a type of optical interferometry akin to that used at gravitational wave observatories to measure the miniscule vibrations in the fabric of spacetime caused by colliding black holes and neutron stars – measures the phase of the small amount of light that gets backscattered in the fibre. If the fibre is stretched at a certain point by, for example, a vibration, it creates a tiny phase difference that can be picked up from one end of the fibre.
Already, distributed fibre optic sensing has been used to monitor glaciers. In 2019, a Swiss team laid 1km of fibre optic cable a few centimetres within the snow cover on the surface of the Rhône Glacier. Disturbances in the optical signal were converted into seismograms that pinpointed rockfalls and icequakes, and results have led to a better understanding of how glaciers move. Brambilla, Masoudi and colleague Martynas Beresna have developed a special fibre and a method to amplify the backscattered signal to allow sensing over 150km, with the potential to be extended to 200km – a distance that would enable scientists to cover and monitor the longest glacier in the world, the Bering Glacier.
But Brambilla and Masoudi see other applications to climate change monitoring too: “If we applied our technology in Antarctica, we would be able to basically pinpoint all the sources of noise along 150km and then map these points in a single line,” says Brambilla. “This could be a powerful way to find where the next nice big iceberg is going to break off from.”
Limiting climate change will call for concerted efforts across society. But to ensure those efforts bear fruit, precise monitoring and analysis of climate change indicators and the sources of emissions are key. Fully exploiting remote sensing, leveraging all parts of the spectrum from the UV to the far-infrared, by land, sea and air, and using new and innovative methods, will be pivotal if humanity is to avert an existential climate catastrophe.