
With an increasing demand for minimally invasive surgeries and diagnostics, it is little surprise that the biophotonics market has seen growth over the past few years, with optical engineering and imaging technologies proving vital thanks to their ability to visualise the manipulation of tissue at remote internal sites.
While the global market for biophotonics has – like many industries – been impacted by the Covid-19 outbreak, early predictions are that it is set to make a recovery. The latest Research and Markets figures, for example, foresee a recovery by 2023, when it is expected to reach $55.13bn – at a CAGR of 10.18 per cent.
One of the challenges when it comes to bringing biophotonic-based devices or instruments to market, is the stringent regulations and testing requirements, which can increase costs and development timescales considerably.
Tools of the trade
Therefore, a great deal of time and effort is put into the design and development of these technologies, and this has been greatly aided by the latest generation of sophisticated optical software tools. Such tools help product developers design and modify medical prototypes virtually, reducing the need for multiple physical prototypes, therefore saving time and money. Optical software simulates the propagation of light through any optomechanical system by raytracing, allowing virtual prototyping of optical systems.
One example of how such software has been used in the design of biomedical equipment is with the simulation of a gonioscope, used to measure the angle between the iris and internal surface of the cornea to help diagnose and treat glaucoma. Photon Engineering’s optical engineering software Fred was used to model how the system would illuminate the eye and collect the reflected light.
Richard Pfisterer, Photon Engineering’s president, said: ‘To begin simulating the gonioscope, an accurate human eye model is required. A model based on relevant references is available in the “Samples” folder of Fred. All essential elements of the eye are included: front and rear surfaces of the cornea, iris, eye lens and aqueous humor. To modify any aspect of the eye model, the user can simply double-click each element to open a multi-tab dialogue box.’
The next step is to model the gonioscopy lens. A tool such as Fred can allow the import of lenses designed in other software programs, such as CodeV (Synopsys), OpticStudio (Zemax) or Oslo (Lambda Research). It can also maintain a local co-ordinate system for each surface, which allows positioning of the goniolens with respect to the cornea. In practice, the lens is coupled to the cornea using index matching fluid. The light source for illumination is created using the software’s detailed optical source type.
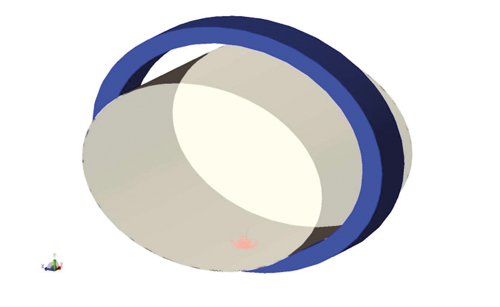
The goniolens model with raytrace paths. Ray colours indicate specific surface intersections (credit: Photon Engineering)
The positions/directions tab can be used to specify source dimensions, the number of rays, as well as angular emission properties. The wavelengths tab, meanwhile, provides options for spectral content and the power tab sets total source power and specifies any spatial apodisation.
The software allows the user to assign a colour to rays in four conditions: reflection, transmission, scattering and diffraction. In this example, rays scattering from the cornea rear surface are changed to green and those scattering from the iris to red.
DNA design
Optical software has also been useful in the design of instruments for DNA analysis that use capillary electrophoresis. This is a technique used in genetic analysis and protein characterisation for its high separation efficiency, short analysis times and low waste generation properties. The technique works by focusing a collimated laser beam into a glass capillary column, where material flows under the influence of an electric potential. When particles pass through the illuminated volume, they fluoresce with a characteristic spectrum.
Pfisterer explained: ‘A collimated rayset can be used to represent a UV laser beam. This is focused by an objective lens into a glass capillary filled with fluid. A mirror placed at the top right enlarges the illuminated volume by reflecting unused light back into the capillary at a slightly different trajectory. The larger illumination volume increases the fluorescent signal. Optics oriented perpendicular to the illumination path collect fluorescent light for analysis.’
The Fred software is able to implement the phenomena of fluorescence through a feature in its scattering library, whereby a scripted scatter model can be constructed to reassign ray wavelengths by interpreting an emission curve in terms of probability. For capillary electrophoresis simulation, an organic dye, Rhodamine 6G, can be used and the spectrum is digitised using the software’s functionality, including the result in a scripted scatter model. ‘To save simulation time, only scattered rays reaching the detector should be traced,’ said Pfisterer. ‘The importance sampling feature in Fred serves just this function.’
All in the head
Researchers are trying to develop the use of optical software in the design of optical systems for two-photon microscopy. A project run by neuroscientist Dr Spencer Smith and his colleagues at the University of North Carolina at Chapel Hill, with support from the National Science Foundation, uses the customisation of optical systems that minimise aberrations across large fields of view.
The project began in 2014 and was funded in part by the White House’s Brain Research through Advancing Innovative Neurotechnologies (Brain) Initiative – designed to increase understanding of the human mind and uncover new ways to treat, prevent and cure brain disorders like Alzheimer’s, schizophrenia, autism, epilepsy and traumatic brain injury.
The microscope has undergone several iterations since then. It is used to image brain activity at the single neuron level over a larger area than previously possible. The microscope enables high-resolution two-photon imaging of multiple brain areas, retaining the resolution that allows observation of individual neurons.
The research team used OpticStudio software from Zemax to model optical systems and optimise performance to maintain and even increase resolution over these much larger areas.
‘Neural activity in the visual cortex represents everything we see. In experiments with mice, we show the mice different types of videos and measure neural activity in the brain in response to that stimuli. We examine how the brain encodes that stimuli, and how it sets up its circuitry in development to do so,’ explained Smith.
Historically, the researchers have only been able to image all this in one little portion of the brain at a time. This is what drove the team to start developing a two-photon microscope that could measure brain activity in multiple areas at the same time, in the same field of view, as well as monitor individual neurons. ‘Simply designing a new microscope objective would not be sufficient. Two-photon microscopy uses a scanning laser to image cells. So, we had to have a scan engine that could scan a large-diameter laser beam at relatively high angles,’ Smith said. ‘Optical scan engines for a large field of view have to be custom engineered. It was a big project!’
Smith contacted companies that undergo this type of optical design and fabrication, and it quickly became clear that it would take six months to a year, and up to hundreds of thousands of dollars to get one version of this system developed. ‘And, if I didn’t get all the parameters just right the first time, I’d be pulling the trigger on a lot of money for something that might not work,’ Smith said. ‘I wouldn’t have the time and resources to do another iteration.’
It was decided that, in order to have the latitude and flexibility to experiment without spending prohibitive amounts of time and money, this development would need to be undertaken in-house. ‘By doing it ourselves, with the right software, we could iterate extensively to see which engineering compromises we could make,’ said Smith.
The optical software was essential to this, particularly thanks to the stock lens matching functionality. ‘That was a tremendously helpful tool to work with,’ said Smith. ‘We could set up the performance we wanted, and the software tries a bunch of variations to get you what you want. We could get an optical system design done, order the stock lenses into the lab in 24 to 48 hours, try it out, and determine additional parameters we needed to hit. Even with custom lenses, we could restrict the optimisation to use materials that we knew our preferred lens maker has in stock. And with the quoting tool, we could find out if something was going to cost $10,000 versus $100,000 to actually build.’
The team was able to develop a working system with the right parameters, which is expected to advance their research considerably. ‘This approach worked even better than I expected – way better. I was hoping for a two-fold, maybe three-fold increase in the field of view. We got a 50-fold to 100-fold increase in the imaging area,’ Smith explained. ‘We could zoom out and see individual neurons – key to our experiments – and see it over a 9.6mm2 area. In mice, that’s pretty much the entire primary visual cortex plus six or seven higher visual areas. This opens up whole new unexplored territories in neuroscience experiments,’ he said.
Health in your hand
In addition to the complex, large lab-based systems that are allowing scientists to observe biological interactions like never before, bringing health monitoring closer to the consumer is another trend gaining traction in the biophotonics market.
Lambda Research’s optical software has been used to help design wearable wrist-based pulse oximeters. While pulse oximetry has been used in hospitals to measure oxygen saturation and pulse rate since the 1970s via devices attached to a patient’s fingers or forehead, only recently has this technique been integrated into consumer devices such as watches and smartphones.
For this new application, wearable device manufacturers need to strike the right balance between performance and style – being small, lightweight and attractive is just as important in the consumer market as robustness and reliability.
A common method for wrist-based wearable devices employing pulse oximetry is to use reflection. Whereas devices using the transmission method have a vertical orientation between the LED source and the photodetector, the reflection method requires the LED source and the photodetector to be on the same surface, with the light passing through the tissue at a set angle. In the case of wearables, this surface may be concave, making the angle between the optical elements variable.
In the reflection method, multiple challenges face the designer, such as the choice of LED manufacturer, the specific LED wavelengths needed for accurate measurement, and the placement and distance of the LED sources and the photodiode.
A wearable pulse oximetry device was designed in Lambda Research’s TracePro software. Credit: Lambda Research Corporation
These parameters can all be tested in Lambda’s TracePro software. In an example, a system was modelled containing an all-in-one sensor from Osram. This chip featured three LEDs emitting at 940nm (infrared), 655nm (red) and 530nm (green), and a photodiode, in a package measuring 4.7 x 2.5 x 0.9mm – along with a light barrier to block optical crosstalk and improve accuracy of the signal. Light enters the tissue following a curved light path to reach the photodiode on the same surface.
Within the software it was determined that, of the three paths by which light can propagate from the LEDs to the photodiode in a wrist wearable, only one was the desired path. The first path slipped under the crosstalk blocker between the LED and photodiode, which could have been a result of the blocker being embedded in clear material which then lifted off the PCB during the cooling process of the embedding material.
The second path travelled over the blocker and hit the epidermis layer of the skin, scattering directly to the photodiode without entering the wrist tissue. This occurs if the wearable is not fixed firmly to the skin using either a watch band with clasp, or locking method to secure it. The third path is the correct path; LED light enters the skin and bulk scatters through a curved trajectory to reach the photodiode.
Because these light paths can be modelled in a virtual environment, the need for multiple prototypes is avoided, reducing costs and time to market.
Optical modelling of biomedical applications
Dave Jacobsen, senior application engineer for Lambda Research, details how TracePro software helps speed up and simplify the design, modelling and analysis of biomedical systems
Optical-based biomedical systems can span a wide range of applications from wearables, pulse oximeters, absorption spectroscopy, fluorescence microscopy and many, many others. These systems use light sources of varying types and wavelength ranges, including UV, visible and infrared. Optical design and analysis programs such as TracePro allow engineers and designers to analyse, optimise and design these types of systems in a virtual environment. This allows for easy and efficient modification of the system parameters, and helps to speed the design process and reduce development costs.
TracePro allows for an easy file exchange with different CAD programs. Designers and engineers can use their preferred CAD program for the mechanical design, then export the model to TracePro for the optical analysis. Typical file formats are SAT, STEP, and IGES. TracePro is based on a 3D solid modelling CAD kernel, so users can also use TracePro for their CAD design. TracePro features an interactive optimiser that gives engineers and designers the capability of optimising the design of light guides, lenses, reflectors, or almost any other optical element automatically, to meet a user-defined goal, such as flux, illumination pattern or uniformity.
The saying ‘garbage in equals garbage out’ can be applied to many things, including optical analysis software. In order to get the best results from an optical analysis, it is necessary to have accurate properties. This can include material properties, surface properties, scattering properties, as well as light source properties. TracePro includes a built-in catalogue on many optical properties, as well as the ability for users to easily add their own properties to the database at any time.
The modelling of the light sources is a critical part of the process. Being able to model the spatial, angular and spectral distribution of the source is extremely important. Some examples of source modelling tools are grid sources, surface source properties and rayfiles. Rayfiles can be downloaded from many LED manufacturers' websites. TracePro can use all of these types of light source models. Light source models can also be mixed and matched.
Once a raytrace has been run, the results need to be analysed. Analysis can include illumination patterns, flux on a detector, angular/intensity distributions, luminance and radiance, polarisation plots, 3D irradiance/illuminance, photorealistic rendering, optical path length, and time-of-flight plots. Results may also need to be displayed in either radiometric or photometric units. TracePro gives users the ability to show all of these results and more.
The design and analysis of biomedical applications often requires specialised tools and capabilities in the optical analysis software. These can include fluorescence, birefringence, bulk or internal scattering, and importance sampling. TracePro includes all of these tools. Accurate modelling and analysis of biomedical systems without these capabilities can be difficult, if not impossible.
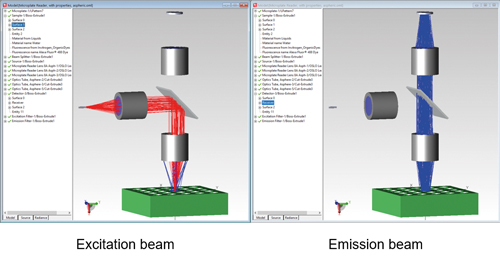
Figure one
The following examples will illustrate some of these capabilities in TracePro. The first example is a fluorescence microplate reader. This model was made using TracePro, Oslo, and RayViz for Solidworks. This method allowed each program to be used for what it does best. Oslo was used to design and optimise the lenses, RayViz for Solidworks was used for the mechanical design, then the system was imported into TracePro for a full optical analysis. In this example, an excitation source is used to illuminate a sample in a sample holder. A fluorescence property is applied to the sample. This sample will then fluoresce according to the fluorescent property applied. An important note is that the fluorescence emission will be from a 3D volume, not just from a surface. Figure 1 shows the excitation and emission beams.
Another example is a pulse oximeter. Here, a red LED shines through a model of a human finger. The finger model includes skin, bone, blood vessels and tendons. A detector on the opposite side of the finger from the source detects the light that has passed through the finger. A major factor in this type of device is accurately modelling the scattering of the skin, bone, blood vessels and tendons. TracePro’s Bulk Scatter property and included catalogue of tissue properties makes this a straightforward process. Figure 2 shows the path of rays getting to the detector through the finger model.
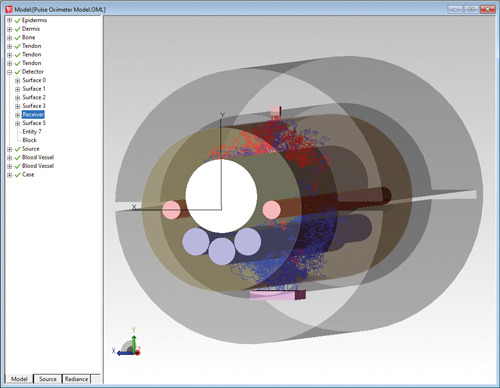
Figure two
Designing, modelling and analysing biomedical systems requires an optical design program that combines excellent CAD tools, accurate properties, accurate source modeling and tools to analyse the results. In many cases, special features such as fluorescence and bulk scattering are also required. TracePro gives the user all of these tools and more.