Spectroscopy has become a powerful, fast, and non-destructive tool for quality analysis and control in the food industry, driven by a growing awareness among consumers about the quality of products they’re purchasing, and the rules and regulations in place that govern this quality.
Using the technique – which itself has evolved over the past decade through the development of more advanced sensors and optical components – properties such as protein, fat, water and sugar content can now be identified at speed without needing to take a physical sample, as well as characteristics such as colour, ripeness, firmness and level of bruising or rot. Such capabilities have therefore made spectroscopy an ideal tool for analysing food in high-throughput sorting and quality control applications, enabling suppliers to offer a consistent level of quality to their consumers.
Quality assurance has become more important following scandals such as the 2008 melamine contamination of milk in China, or the 2013 horse meat scandal in the UK, which have led to governments and regulatory agencies establishing stricter policies in order to prevent further contamination from happening in the future.
Responding to these trends, the food industry has become more familiar with screening techniques such as spectroscopy, according to Marco Snikkers, business development and strategy for food and agriculture at Ocean Optics. ‘The need for faster, easier to use screening techniques is being driven by regulatory agencies and consumers,’ he said.
Evidence of this can be seen in a recent market report by Transparency Market Research, in which it states that applications in food and agriculture have led to a significant uptake of spectroscopy, and that the process spectroscopy market is expected to be worth more than $2 billion by the end of 2025.
Spectral sorting
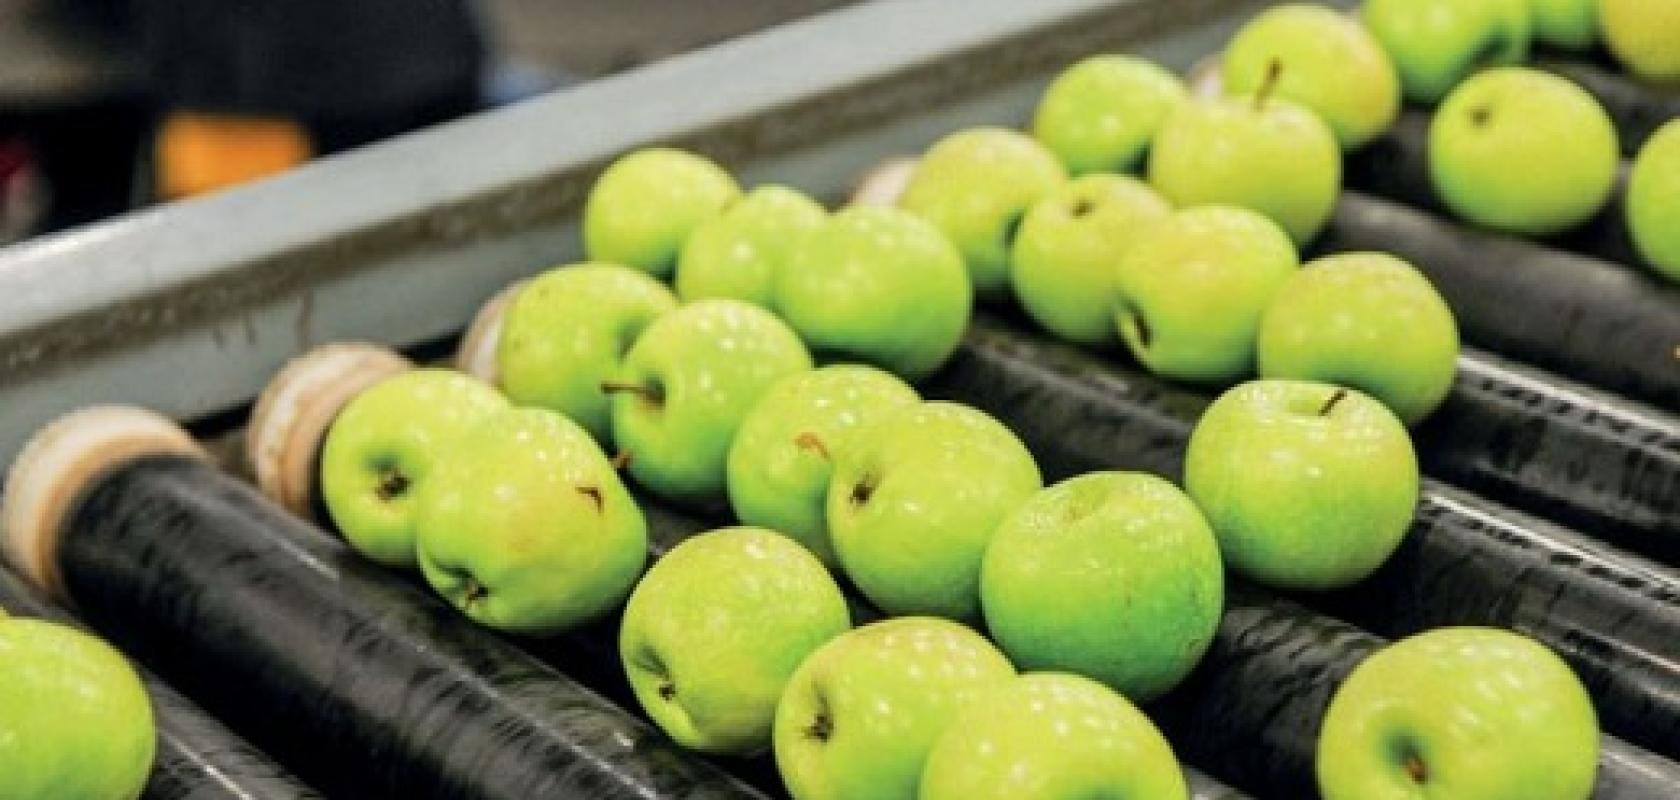
Sorting applications have long been an end-use of spectroscopy in the food industry. Avantes’ near-infrared technology, for example, has been used to inspect apples for more than a decade, according to product manager Ger Loop.
Apple sorting can be performed by positioning the spectrometer above a conveyor system in a production line. Should an apple fail to meet the inspection criteria – for example, after spectral analysis reveals excessive bruising – the control system will record the time of the spectroscopy measurement and use it to calculate the opening of a selection valve in order to remove it from the main batch.
‘This application of spectroscopy [apple sorting] was first published in the Journal of Food Quality around 10 years ago after researchers employed Avantes’ AvaSpec-ULS2048-USB2 – operating between 600 and 1,100nm – to study the near-infrared spectra of Fuji apples,’ Loop said. ‘Using the spectra, the researchers were able to develop an algorithm that correlates fruit characteristics for solid content, water content and firmness. They were then able to later isolate sensitive wavelengths useful for predicting internal fruit quality.’
Isolating wavelengths like this is an important step in reducing the dataset needed to analyse different types of produce when designing high-throughput sorting solutions, as it prevents the need to monitor the entire NIR spectra whenever an item passes under the spectrometer. ‘This becomes integral to the development of high speed, portable and inline sensing systems,’ Loop added.
While the 600-1,100nm range is used to analyse fruit such as apples, when looking to analyse other food products, such as grain or maize, for example, wavelengths higher up in the NIR range up to 1,700nm are required, according Loop, as water content can be measured more effectively at these wavelengths.
The light of NIR spectroscopy is ideal for analysing the internal composition of food thanks to its ability to penetrate fairly deeply with less scattering and probe the vibrational overtone absorption of chemical bonds. The resulting spectra are often broad, overlapping and complex. However, when they are processed using a well-developed chemometric model, they can be used to identify complex characteristics. In the case of an apple, this could be its ripeness, sweetness or storage duration.
Applications in the food industry are considered to be one of the primary drivers of the NIR spectroscopy market, which is expected to grow at a CAGR of more than nine per cent between 2017 and 2021, according to market research firm Technavio last year. A separate report by Global Market Insights found that the NIR sector will make up more than 55 per cent of the overall process spectroscopy market by 2024, aided by surging demand in the food industry.
This correlates with the boom in customers that Avantes has noticed recently for its NIR spectrometers used in food sorting, which – according to Loop – have become much faster and more accurate over the past decade thanks to improvements to chemometric models and the sensitivity of spectrometers.
‘Apples can be measured at a much faster rate now using higher sensitivity spectroscopy equipment, such as our AvaSpec-HS2048XL-Evo from our SensLine, which enables up to 10 apples per second to be inspected,’ he said.
Loop explained this increase in speed by likening a spectrometer to a camera; just as cameras equipped with better sensor technology are able to capture images in shorter exposures, spectrometers using more advanced sensors can perform faster measurements. Produce can therefore be passed underneath such systems at increased speeds while still being analysed, allowing it to be sorted at higher throughputs.
According to Loop, most compact spectrometers on the market currently use CCD sensor technology, however this is expected to become obsolete by 2020 with the advent of CMOS sensors. Spectrometer manufacturers are having to embrace the newer technology in order to be prepared for applications in the next decade. ‘This is something we have to adapt to as a spectrometer company,’ Loop remarked.
Although Avantes introduced CMOS-based solutions two years ago, the transition of the technology into industry is still underway. This is because, for the current users of spectroscopy, switching to the latest sensor offerings requires more than simply purchasing a new instrument and installing it in an existing application.
Existing customers ‘will have to develop new chemometric models if they want to use the new CMOS detectors, as they have a different response behaviour to conventional CCD detectors,’ Loop explained. ‘This requires a lot of work. However, by introducing the technology two years ago we are giving our customers enough time to make the transition successfully before the commonly used CCD chips become obsolete.’ This is less of an issue for customers using spectroscopy for the first time, which can instead base their chemometric models on the newest spectrometers on the market.
Ocean Optics has also taken full advantage of the increased sensitivity granted by CMOS technology, having equipped its Ocean FX with Hamamatsu’s S11639 detector. Capable of reaching acquisition speeds of up to 4,500 scans per second and working in both the UV-Vis and Vis-NIR ranges, the spectrometer is suited to performing absorbance/transmission and colour measurements on a large number of food items on high-throughput production lines.
In addition to more powerful sensor technology, Snikkers, of Ocean Optics, highlighted that smaller, more powerful microprocessors and new data analysis techniques driven by machine learning are also aiding the application of spectroscopy in the food industry.
‘Data analysis is evolving quickly, from traditional chemometrics to artificial intelligence and machine learning, which together with processor speed, help to get faster and more accurate answers [from spectroscopy],’ Snikkers said.
‘With new, cloud-based big data technology to connect sensors throughout the food chain, growers and processors can now more accurately spot trends and predict results,’ he continued. ‘This lets producers make logistical decisions – for example, where to send a certain batch – earlier and more confidently.’
Snikkers expressed that the need for data to increase yields and performing analysis in the food industry will only increase exponentially in the coming years.
‘Industry 4.0 is really at work in the food industry, and different types of sensors – of which spectral sensing is only one – will work together to provide that data,’ he said. ‘Technology will make sensors smaller and faster, and companies like Ocean Optics will make the analysis for users easier and readily available, also to non-experts. This will happen throughout the food chain all the way to the consumer.’
Reliable replication
For a spectrometer to be suited to high throughput inspection on food production lines, not only does it have to be both fast and sensitive, according to Loop, but also robust enough to cope with the continuous vibration of sorting machines. Designing and manufacturing a system with no moving parts is therefore key to preventing disruption from such vibrations, which would otherwise lead to the instrument needing to be re-adjusted daily.
The positioning of optical components in such spectrometers presents a particular challenge during manufacturing, however, as the process must be done precisely and with a high level of reproducibility across multiple products.
‘This is particularly important when equipping food sorting machines with spectroscopy, as certain [chemometric] models already exist that are used to determine the quality of food from obtained spectra,’ Loop explained. ‘This modelling is very time consuming to prepare and there’s a lot of IP involved. It’s essential for customers that our spectrometers are all exactly the same, so that this same model can be used alongside each instrument across their multiple production lines.’
Avantes is therefore switching from using manual adjustment procedures to semi-automated machinery when positioning each optical component inside its spectrometers, enabling the instruments to be to more accurately produced to a computerised model and thus to a higher level of consistency.
The right laser for Raman
When building a Raman spectrometer, Elizabeth Illy, director of marketing at laser maker Cobolt, noted that the key demands on the lasers are narrow line width, excellent wavelength stability and accuracy, and a clean spectrum. Raman spectroscopy, which can be used in food analysis, is one of Cobolt’s target application areas for its laser sources.
The most common wavelength used in Raman spectroscopy is 785nm. According to Cobolt, it offers the best balance between scattering efficiency, influence of fluorescence, detector efficiency and availability of high-quality laser sources. However, the use of visible lasers in the blue and green is increasing.
The spectral line width sets a limit on the spectral resolution of the recorded Raman signal, i.e. how small of a difference in Stokes shift can be detected. For most fixed-grating systems, the laser line width should be a few 10pm or less to avoid limiting the spectral resolution of the system, according to Cobolt. However, high resolution systems may require line widths less than that.
The laser line must stay fixed in wavelength while recording the spectrogram, so that spectral resolution doesn’t deteriorate.
Detecting the Raman signal normally requires a spectral purity of 60dB from the laser. For many cases, it is sufficient if the level of spectral purity is reached at around 1 to 2nm from the main peak.
In confocal Raman imaging applications, it is necessary to use diffraction limited TEM00 beams for optimum spatial resolution. For probe-based quantitative Raman analysis, the requirement is not as tight, Cobolt says. It is normally sufficient with a beam quality that allows for efficient coupling into multi-mode fibres, such as those with 50 to 100μm core diameters.
Typical laser output powers range from around 10mW in the UV, up to several 100mW in the near-infrared. The output power requirement is related to the wavelength, the type of material to be investigated, plus sampling frequencies and imaging speeds.