When Dutch researcher Paul Crutzen won the 1995 Nobel Prize in Chemistry for discovering the ozone decay threat, the Netherlands government established a firm policy to study atmospheric gases.
Climate change is similarly motivating, given the country is two thirds below sea level, explains Harry Förster, national projects coordinator at the Netherlands Space Office (NSO) in The Hague. ‘Our government has stated, “We will do everything to keep our feet dry”,’ he says. The country’s policy makers therefore want the best information from scientists, who in turn want good atmospheric data from satellite instruments.
That led to the NSO’s involvement in the Global Ozone Monitoring Experiment (GOME) instrument, on the second European Remote Sensing (ERS-2) satellite launched in 1995. It scanned strips across the planet recording absorption spectra in reflected and scattered sunlight over wavelengths from 240 to 790nm, identifying atmospheric gases, resolving 90 to 120km by 60 to 130km areas. In decades since, NSO has invested in several instruments improving these capabilities. The latest is the TROPOspheric Monitoring Instrument (Tropomi), which launched on the European Space Agency (ESA) Sentinel-5 Precursor satellite in October 2017.
Tropomi’s resolution is now 2.5km by 3.7km, which ‘gives you a clue where emissions are released, in which area’ Förster says. ‘Bigger cities like Rotterdam, for example, can now be covered by about 8 to 10 pixels.’
It has broken up spectra to detect absorption according to specific trace gases of interest, with regions spanning 270-320nm, 320-500nm, 675nm-775nm and 2,305-2,385nm light wavelengths.
And whereas the maximum swath that GOME could cover was 900km, Tropomi’s is 2,600km. ‘Every day it passes every point on the globe,’ Förster enthuses. ‘In one pass it provides data that in the early days you had to record for a month on average.’
But scanning areas to record spectrometric data that provides useful information remotely is important for much more than just atmospheric gases. Many call such powerful approaches multispectral imaging if, like Tropomi, instruments are tuned to certain bands. In hyperspectral imaging, instruments capture continuous spectra spanning the entire ultra-violet (UV) to short-wave infrared (SWIR) range.
Robert O Green, a senior research scientist at Nasa’s Jet Propulsion Laboratory (JPL) in Pasadena, California, calls his team’s approach ‘imaging spectroscopy’. He cites Nasa’s Hyperion imaging spectrometer his team contributed to, which recorded more than 200 wavelengths aboard the Earth Observing-1 satellite from 2000 to 2017. With it, scientists mapped ‘the largest known methane leak in US history’ in Aliso Canyon, California, from orbit, for example. JPL also built the Moon Minerology Mapper (M3) imaging spectrometer, which detected water on the moon in 2008-2009. ‘This ability to collect a spectrum for every point in an image is far more powerful than just a few wavelengths,’ Green says.
Green adds many applications still demand more from the technology. ‘Fundamentally, in plants, in rocks, in coastal oceans, there are key molecules that interact with light in different ways, so there are complex spectral signatures,’ he says. ‘A spectrometer allows you to see different molecules and interactions in the system, so that you can map species types, rock-types and the melting status of snow, and whether there’s dust causing it to melt faster.’
Grating expectations
JPL scientists are, therefore, working on further instrument improvements. For example, the Mapping Imaging Spectrometer for Europa (MISE) will be aboard Nasa’s Europa Clipper mission to study the icy moon of Jupiter, due to launch in the 2020s. One important factor relating to the imaging spectrometer light collection and, in turn, spectral and spatial resolution is the optical system’s f-number, the ratio of its focal length to its entrance pupil diameter. ‘We want to have high optical throughput,’ Green says. ‘M3 was F3.5.’ MISE is currently targeting F1.4, Green says.
Imaging spectroscopy also commonly uses gratings to break up the light instruments receive into separate regions of the spectrum and direct them to different detectors. The shape in which the grooves in such gratings are sculpted determines how efficiently they diffract light. Typically the grooves are right-angled triangles, with shapes characterised by the ‘blaze angle’ between the sloping ‘blaze’ side and the horizontal surface. ‘We’ve learned how to put multiple facets on the blaze, to tune the efficiency over multiple octaves of wavelength,’ Green says.
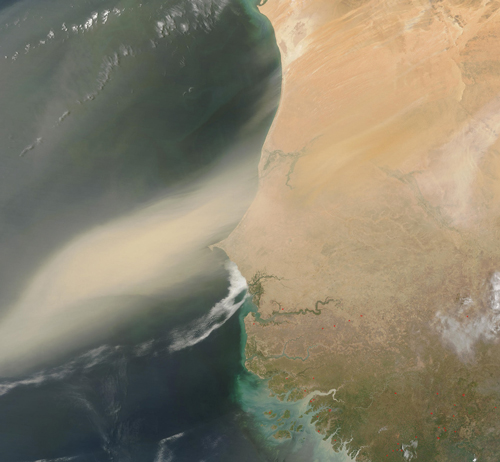
The imaging spectroscopy instrument EMIT - mounted to the exterior of the International Space Station - will determine the mineral composition of natural sources that produce dust aerosols around the world to answer the question of whether this type of aerosol warms or cools the atmosphere. This 2003 satellite image shows a large dust plume blowing off the Sahara Desert and out over the Atlantic Ocean. Credit: Nasa
In addition, a typical single-blazed grating might only span the 400 to 800nm range. ‘At JPL, we’ve developed gratings that have structures on their blaze so that you can have a single grating spectrometer that measures from 400-3,000nm, like M3,’ Green says.
Tropomi’s gratings are so important, Förster explains, that getting them right took a two-year development project before work on the rest of the instrument could start. Typically, incoming light immediately hits the surface of a conventional grating and reflects at several angles, dispersing towards detectors. By contrast, the immersed gratings that Tropomi uses are designed so that light first travels through the grating’s bulk material, before hitting the grating at its rear surfaces. The light then travels back through the bulk material, dispersing all the while. Then, when the dispersed light leaves the bulk material, it refracts again. This gives much better dispersion, Förster says, which helps lower the instrument’s volume. To produce the specific geometry involved using highly advanced silicon manufacturing, he adds, in collaboration with leading lithography tool supplier ASML, in Veldhoven, Netherlands.
Diffraction gratings are a core technology for Massachusetts-based imaging spectrometer designer and manufacturer Headwall Photonics. David Bannon, the company’s chief executive officer, explains that Headwall is able to make aberration-corrected image sensors using convex diffraction gratings built with precise groove profiles and depths. ‘In any airborne or space-borne application aberration-corrected instruments eliminate the inherent keystone and smile aberrations typically seen in most imaging spectrometers,’ Bannon says.
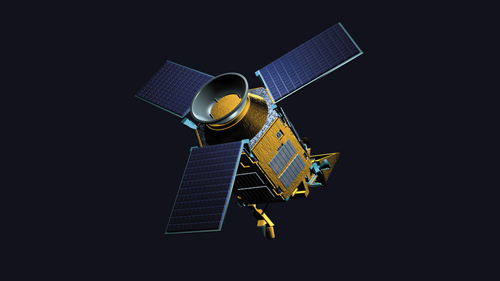
An artist's impression of Sentinel-5 Precursor, the satellite with the Dutch instrument Tropomi on board. Credit: ESA
Headwall uses both diamond-turned and holographic diffraction gratings and mirrors, Bannon says. ‘Reflected light enters a foreoptic lens, then an entrance slit that defines the field of view of the sensor, the flight swath,’ he adds. The grating diffracts the reflected light, separating it by wavelength. Each wavelength is focused onto concentric mirrors and then a focal plane array that records spectra. Headwall’s remote sensing imaging spectrometers cover spectral regions within the 400nm to 2,500nm spectral bandpass, from visible through to shortwave infrared.
Data calibrators
Headwall’s technology can be used in either multispectral or hyperspectral imaging. ‘For example, most multispectral sensors cover from four to eight bands,’ Bannon says.
‘Headwall’s Nano-Hyperspec covers 270 spectral bands. Users might very well start with a hyperspectral imaging sensor to identify those spectral bands of interest, and then move to a multispectral sensor tuned to those bands. However, missions change over time; the spectral bands of interest may not be those of interest next month or next year. In these cases, having hundreds of spectral bands that are narrow, and essentially contiguous, provides the highest degree of classification, no matter the application.’
Headwall’s products can serve applications looking at satellite-mounted greenhouse gas detection sensors, as well as air-quality assessment. They also serve Earth-borne observation applications, using just two sensors to cover the 400nm to 2,500nm range. For this application, Headwall has long been working with Nasa Goddard Space Flight Center in developing an aeroplane-mounted ‘pod of remote sensing instruments known as G-LiHT’. ‘The system is so critical, it is not only used for Earth-borne applications, it has been used for disaster monitoring and is used to calibrate satellite data,’ Bannon says.
Neville Davies, senior European applications manager at Ocean Optics, emphasises the importance of such calibrations. ‘Whilst satellites are equipped with spectroscopy instrumentation, Ocean Optics miniature portable platforms are more commonly used for ground-truthing the satellite data,’ he says. ‘Remote sensing satellites produce huge amounts of global data which needs to be corroborated, validated or calibrated at ground level. A modular spectrometer can be configured for measurements at the leaf and canopy scale, so that comparisons can be made with satellite data to account for atmospheric effects and scaling problems.’
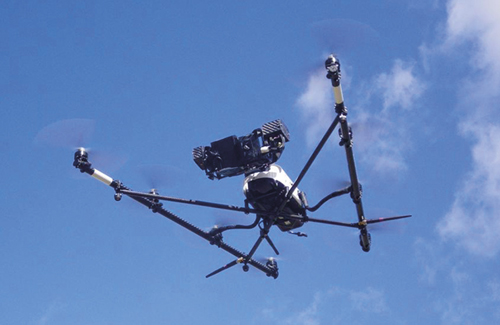
Simpler spectrometers can be used together with unmanned aerial vehicles to validate images from satellites. Credit: Ocean Optics
However, Davies notes that despite its flexibility, a spectrometer is a point measurement instrument, so spatial context must be added to the data via GPS or fixed site locations, for example. ‘A miniature spectrometer can be used in the lab, configured for portable studies, flown on a UAV, or can be made field deployable for phenological studies from flux towers,’ he says. ‘This kind of flexibility lends itself to wide use by the remote sensing scientific communities.’
Ocean Optics’ spectrometers are being deployed in this way in up/downwelling reflectivity, for example to measure crop, grassland and forest cover. In this approach, two channels make measurements, one recording downwelling solar light data, the other upwelling reflected light.
‘This can be done at the ground level from a handheld boom, at canopy level from a tower, or above canopy with a UAV or plane,’ Davies says. ‘There are many reflection indices and algorithms that have been developed to analyse data collected in this way. At leaf level, measurements of absorbance can be made using a leaf clip system to understand how much of the incoming light is really absorbed by the leaf, such that it can go on to contribute to photosynthetic processes.’
Resolution revolution
Another measurement technique gaining momentum is solar induced fluorescence (SIF), Davies says, which determines chlorophyll fluorescence emission from ground level. SIF is a complex measurement which applies spectral fitting to the up/downwelling spectrum, either across the atmospheric oxygen absorbance bands or the characteristic Fraunhofer spectral absorption lines.
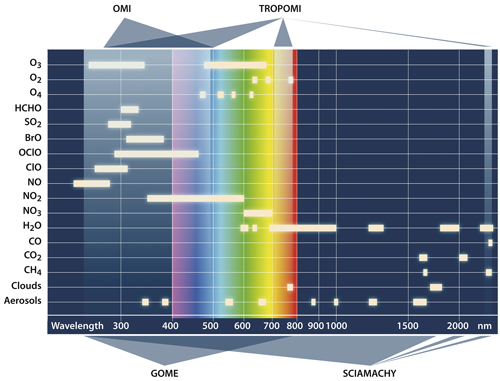
The wavelenght range of the measuring instruments Sciamachy, Gome, Omi and Tropomi, and the substances that these instruments can observe. Credit: Dutch Space
‘The chlorophyll fluorescence actively emitted from a plant is interesting, since it is one pathway by which the plant can reject light energy in excess of what it needs for photosynthesis,’ Davies notes. This is essentially the measurement that ESA’s Fluorescence Explorer (FLEX) satellite mission will make from space after its projected launch date in 2022, he adds.
Due to the likely importance of SIF measurements, much effort is now being made to establish widespread measurement networks at ground level.
‘The Ocean Optics QEPRO spectrometer, configured in a certain way, has become very popular for this measurement,’ Davies comments.
As such, Ocean Optics supplies experimenters with configured component parts of a measurement system for research. Alternatively, its original equipment manufacturer partner JB Hyperspectral, based in Düsseldorf, Germany, supplies customers with fully-configured campaign-ready systems.
SIF for agricultural applications to assess crop health and yield is another focus for Headwall’s satellite remote sensing products. ‘There are very strong economic motivations for pursuing these space-based measurements,’ Bannon says. ‘The SIF imager used by Nasa now has a very narrow range from 670 to 780nm, but very high resolution, 0.1 to 0.2nm spectral resolution, within that range. This is necessary because SIF signals are very weak.’
Other vegetation measurements include studying ecosystem change. To get the high frequency measurements and sub-100m spatial resolution this needs requires a satellite constellation, Bannon says. Economical mass-produced Cubesat modules could be a cheap way to do this. However, because they’re only small, the spectral coverage of imaging spectrometers used will be limited in scope, with different regions therefore split between different Cubesats.
Headwall is therefore working on a cryo-cooled hyperspectral SWIR imager for a low-earth-orbit space environment with harsh thermal and radiation conditions. Size, power and cooling requirements make SWIR the constellation’s more technically challenging components, Bannon says.
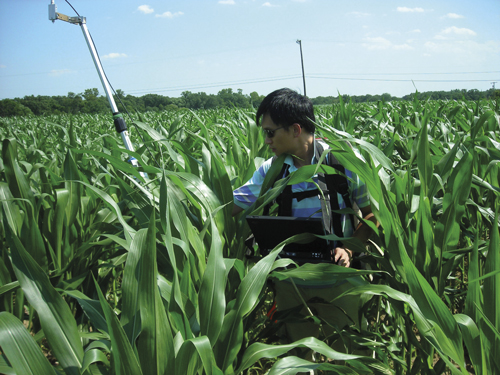
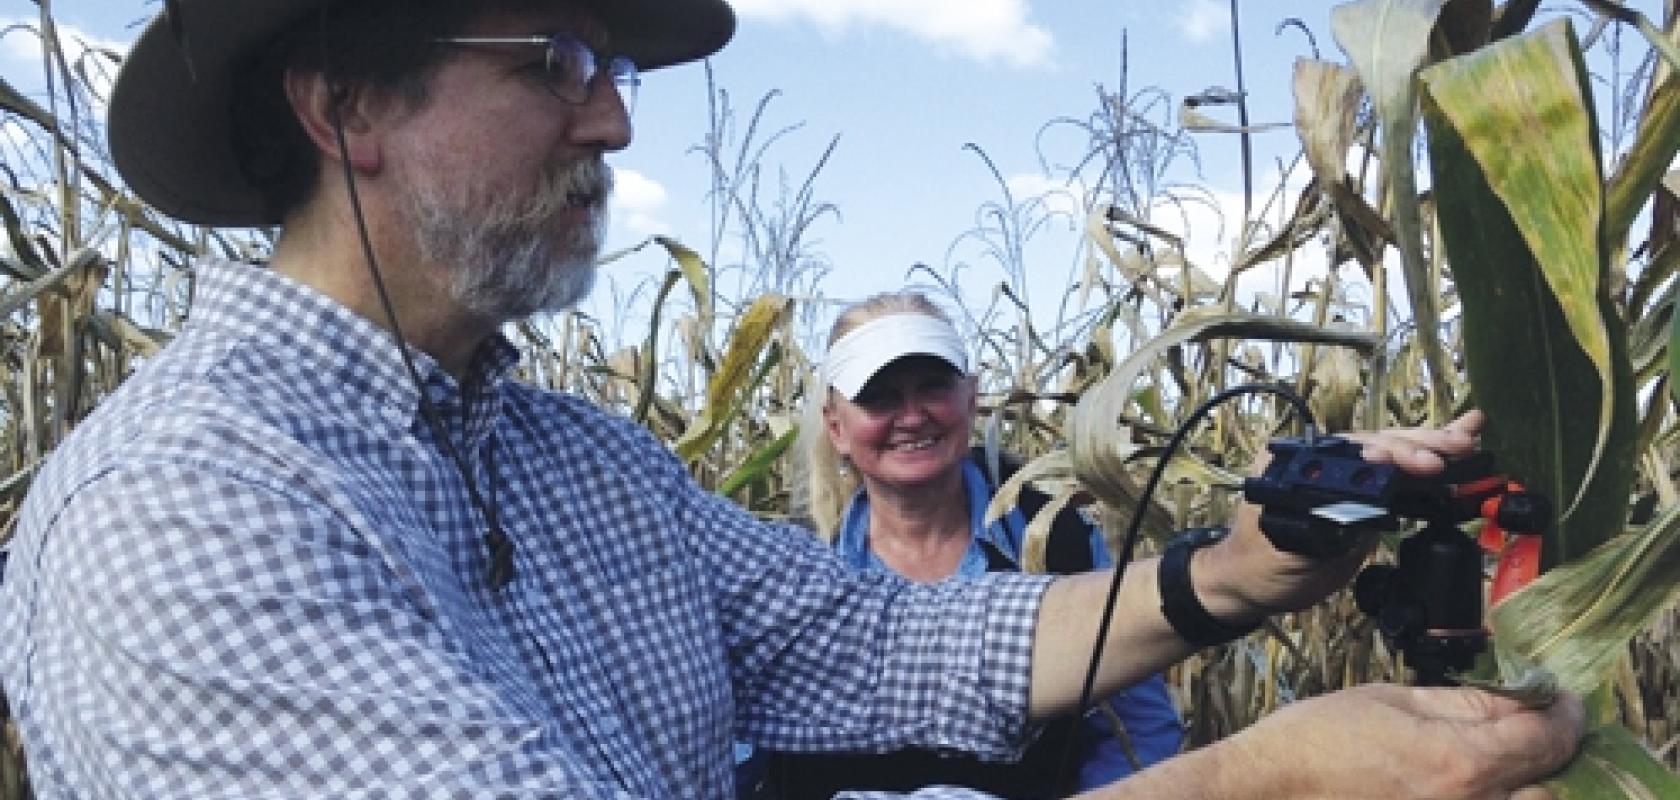
Measuring canopy spectral reflectance of maize as part of Nasa's Spectral Bio-Indicators study. Credit: Nasa
Similarly, the NSA is considering how to exploit technology like Tropomi’s on Cubesats. This will help attain spatial resolution below 1km by 1km to identify pollutant emission sources, ‘a kind of policing from space’, Förster says.
Meanwhile, Green is principal investigator for the Earth Surface Mineral Dust Source Investigation (EMIT), which is due to be mounted on the International Space Station in 2021. Work started on the 380-2,510nm imaging spectrometer, which will be based in part on the M3 instrument, last month. It will study the mineral composition of natural sources that produce dust aerosols around the world, to help determine whether this dust warms or cools the atmosphere.
‘We’re working at the very forefront of what’s the hardest thing to do,’ Green stresses. And when those hard problems have been solved, he’s ‘very supportive of this approach getting used broadly, wherever it makes sense’.
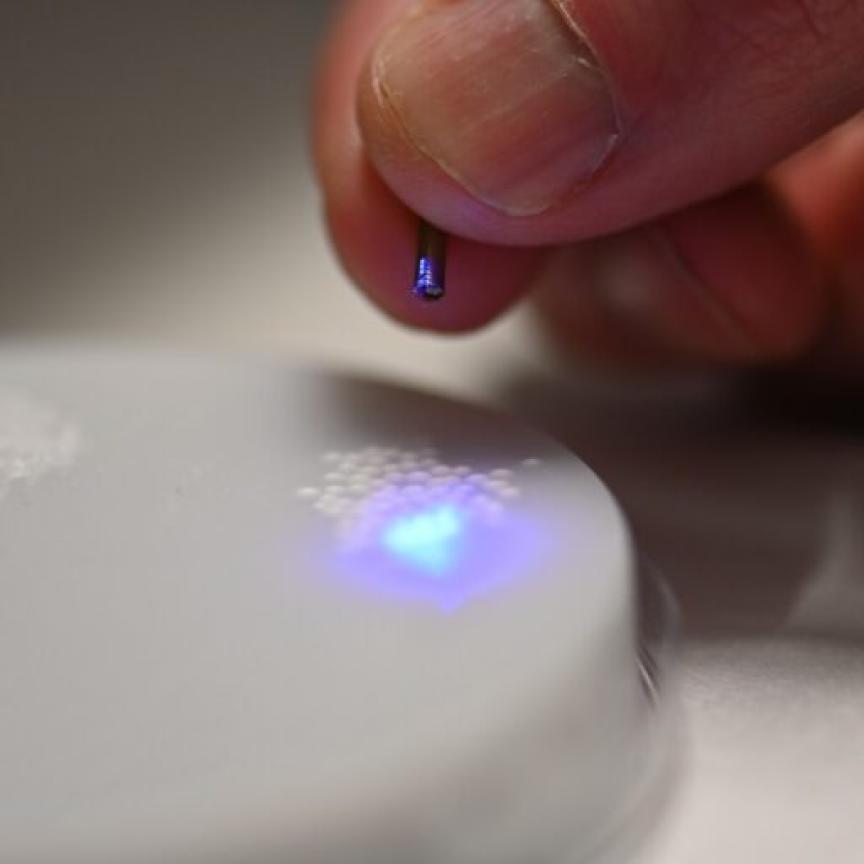
Top image: Measuring leaf spectral reflectance and fluorescence in the USDA Beltsville Agricultural Research Center cornfield. Credit: Nasa