Identifying Natural and Synthetic Gems
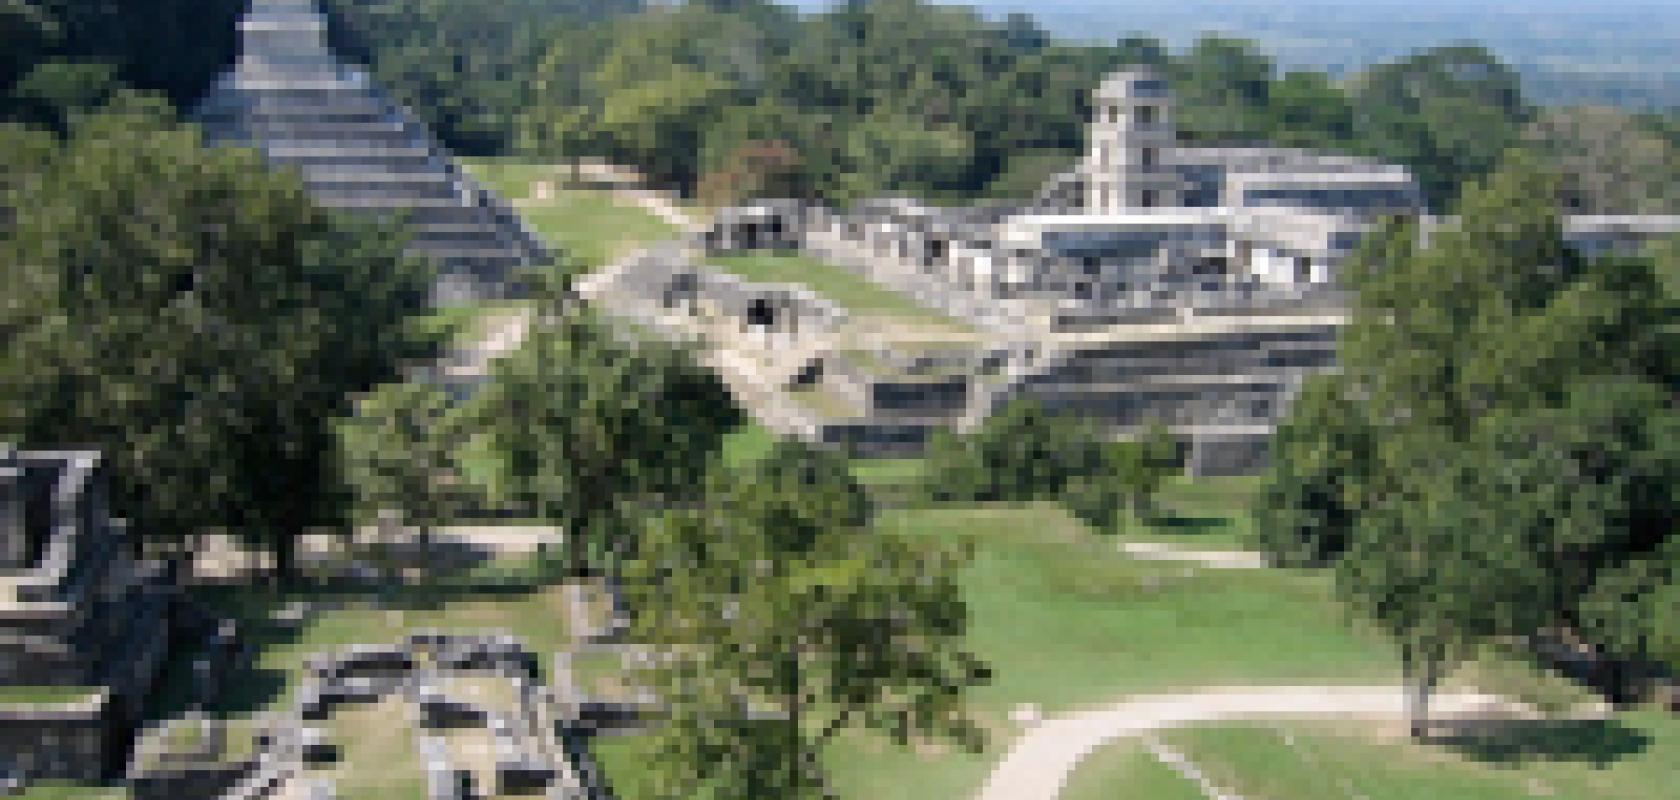
My first vacation after being hired as an applications engineer at Ocean Optics was to the Yucatán Peninsula of Mexico. Ever intrepid, I convinced my friends to drive south and inland to the 7th century Mayan ruins of Palenque in the Chiapas region. What was supposed to be a 10-hour drive was far longer in our tiny rental car, thanks in part to the speed bumps that graced our passage through each rural town. The effort felt well worth it, however, as we climbed steep temple stairs and wandered through dwellings created and abandoned over a thousand years ago.
So when I recently came across a journal article on optical spectroscopy of amber from the Chiapas region, I was intrigued. I was familiar with Raman spectroscopy for gemstone authentication, but not luminescence – and so a new adventure began. The more I read, the more I discovered that luminescence is a highly complementary technique to Raman in the world of gemstone authentication.
Fluorescence measurements easily distinguish real amber from artificially created resin, while photoluminescence generated during Raman studies can detect dyes used to enhance the color of pearls and coral. Both photoluminescence and ionoluminescence of precious gems like emerald and ruby can be used to discriminate natural stones from artificial. They can even alert gemologists to treatments used to alter the color of natural and artificial diamonds. What’s more, every one of these measurements can be made with an Ocean Optics spectrometer.
Chiapas Amber: Fluorescence Marks the Spot

Image: Courtesy of Cher Fox, a jeweler of custom made rings with Chiapas amber
Though amber is found in several regions in the world, Chiapas amber is prized for its transparency and stunning colors, varying from honey to green, blue, violet and a unique deep red. Harder than amber from the Baltic and other regions, it is ideal for jewelry and carvings. This fossilized resin took millions of years to form, yet is sometimes imitated using artificial resins and glasses.

Figure 1: Fluorescence setup for analysis of amber authenticity.
Investigators at the Centro de Investigaciones en Óptica, A. C. in León, Mexico1 compared false amber to specimens from the Baltic and Chiapas regions, looking at fluorescence excited with a tunable Argon-ion laser at 457, 488, 514 nm and multi-line outputs (Figure 1).
Fluorescence was detected with a USB4000 spectrometer for the Chiapas (Figure 2a) and Baltic amber (Figure 2b), superimposed with the scattered laser light, but no fluorescence was seen for the false amber at all (Figure 2c). Even comparing fluorescence spectra for the true amber, a slight shift in the emission peak could be seen for the Chiapas amber (~525 nm) as compared to the Baltic amber (~535 nm). The researchers found that Raman spectroscopy was also able to distinguish false from true amber, and more clearly distinguish between amber from different regions.

Figure 2a: Chiapas amber

Figure 2b: Baltic amber

Figure 2c: False amber
** Note that the laser power levels used to induce this fluorescence were relatively low, and thus the measurement was non-destructive. “Soft” samples such as amber should be treated carefully when working with lasers, as high fluences can cause physical damage.
Photoluminescence Enhances Raman Spectra of Gems
Raman spectroscopy can be used to quickly and accurately distinguish many imitation or artificially created gemstones. In fact, colorless and near colorless diamonds can be separated from their simulants in less than 0.1 seconds using commercial instruments like the GemmoRaman-5322.
The same 532 nm laser used to excite Raman signal in this type of system also induces photoluminescence of trace elements in the crystal lattice like chromophores and rare earth elements. The photoluminescence may occur in the region above the Raman fingerprint zone, appear as a broad background upon which Raman peaks are superimposed, or even overwhelm the Raman signal entirely. Photoluminescence collected simultaneously with the Raman spectra is extremely valuable, as it can help distinguish synthetic gems from their natural counterparts and be useful in detecting various treatments.
A QE Pro spectrometer configured for Raman spectroscopy has both the sensitivity to collect Raman and photoluminescence spectra, and the resolution to produce detailed spectra for accurate analysis of gemstone composition.
Pearls of a Different Color
These revolutionary cultured pearls are over 90% pearl nacre. See more at: http://www.honora.com/learn-about-honora/freshwater-pearls/#sthash.3MlOEx6V.dpuf
Cultured freshwater pearls get their natural colors from organic pigments called polyenes, which conveniently exhibit enhanced Raman scattering. Dyes can be used to produce colored pearls to simulate the more rare natural specimens; it can be difficult for a gemologist to conclusively rule out their use by visual means. Spectroscopy, however, tells a different story.
Cultured freshwater pearls in their natural state have a broad, consistently-shaped luminescence peak punctuated by Raman peaks attributable to aragonite (a form of calcium carbonate, identified by the green arrows in the left graph below) and the polyene compounds (red arrows), as shown in Figure 3a. Dyed cultured freshwater pearls, in clear contrast, can exhibit a variety of luminescence curves due to the dyeing agents (Figure 3b). While it may not be possible to identify the dyeing agent, photoluminescence-enhanced Raman spectroscopy makes it very easy to identify the use or absence of dyes and validate the value of cultured freshwater pearls.

Figure3a: Cultured Freshwater Pearls (CFWP) in their natural state

Figure 3b: Cultured Freshwater Pearls (CFWP) affected by dyeing
** As noted previously, high laser fluences can cause physical damage to some samples like pearl. The measurements shown above were non-destructive when performed on light colored freshwater pearls, but very dark or black pearls may absorb strongly and sustain damage under testing with Raman spectroscopy.
Protecting Coral and Its Color
Coral comes in a wide variety of shades, from light pink to deep red. While coral itself can be positively identified by looking under a microscope for the characteristic grooves used to transport nutrients, the traditional test for dyed coral requires swabbing with acetone, risking damage to the sample.
Naturally colored coral has distinctive Raman peaks on a characteristic photoluminescence background. The Raman peaks indicate forms of calcium carbonate, as well as the polyacetylenes and carotenoids that imbue coral with such beautiful color. When dyed coral is subjected to the same measurement, a much broader photoluminescence curve is seen (top trace), both centered at a different wavelength and lacking Raman peaks (Figure 4).

Figure 4: Spectral characteristics of natural and dyed corals as measured using Raman spectroscopy
In fact, Raman can also distinguish between endangered Stylaster corals (protected by the Convention on International Trade in Endangered Species) and the more common Corallium corals permitted for legal trade, demonstrating the power of Raman techniques to validate coral value and deter illegal activity involving protected species.
To learn more, visit http://www.gemmoraman.com/Articles/RedCoral.aspx.
Giving Real Emerald the Green Light
Emeralds owe their stunning deep green color to the presence of chromium (Cr3+) and vanadium (V3+) ions in a beryl crystal matrix. Both natural and synthetic emerald has the same chemical structure, making it difficult to discriminate the two. While emeralds exhibit no distinctive Raman peaks, they do show two Cr3+photoluminescence bands, the exact positions of which are influenced by the presence of other impurities like magnesium, titanium and zinc in the beryl structure. This allows synthetic emerald to be distinguished from the two natural types of emerald, schist and non-schist.
Synthetic emerald also tends to have higher chromium ion concentrations than natural emerald, which results in stronger photoluminescence peaks. Even when a natural emerald owes its color primarily to vanadium ions, the chromium ion concentration is still high enough to exhibit photoluminescence, making this a very effective method to authenticate natural emeralds (Figure 5).

Figure 5: Spectral characteristics of natural and synthetic emeralds
Photoluminescence is a Diamond’s Best Friend
Raman spectroscopy is routinely used to separate natural from CVD-grown synthetic diamonds using the presence or absence of a strong Raman peak at 1332 cm-1. It can be more difficult, however, to identify high-pressure, high-temperature (HPHT) treated diamonds.
HPHT treatment is used to alter near-worthless brown and gray type IIa diamonds to near-colorless by annealing the strain present within the diamond lattice. HPHT-processed diamonds cost 45%-65% less than their untreated counterparts, but are not always labeled as such, creating the potential for fraud.
Photoluminescence peaks obtained in tandem with the Raman spectra of diamonds offer clues as to the use of HPHT treatment. Naturally clear diamonds typically exhibit a number of smaller photoluminescence peaks in the range 530-600 nm (see upper scale on spectrum). HPHT treatment removes most of these peaks, leaving only nitrogen-vacancy peaks at 576 nm and 637 nm in some samples.

Figure 6: HPHT Treated vs. Untreated Diamonds
Ionoluminescence
Ionoluminescence is the generation of luminescence through bombardment of a sample with a high energy particle beam from an accelerator. Excitation energy is in the MeV (milli-electron volt) range, allowing access to higher energy levels to detect impurities or defects in gemstones. As with the photoluminescence measurements described previously, ionoluminescence can be used to discriminate between natural and imitation gemstones including ruby, sapphire and emerald3.
Ruby has long been imitated with red spinel, one of the most famous examples being the “Black Prince Ruby” set in the English crown. Ruby obtains its rich red color from chromium ions (Cr3+), while synthetic spinel also has impurities like manganese (Mn2+). Synthetic spinel has a characteristic ionoluminescence response just above 500 nm indicating the presence of manganese, allowing imitation ruby to be conclusively identified.
Similarly, blue sapphire can be distinguished from blue kyanite, a less expensive substitute. Even though the ionoluminescence spectra of both show evidence of Cr3+ transitions at ~700 nm, authentic blue sapphire has an additional broad peak at 300-400 nm due to the presence of naturally occurring defects. In the case of emerald, both the natural and synthetic stones feature a similar ionoluminescence peak, with that of synthetic emerald being broader and much lower in intensity than that for natural emerald.
Conclusion

Photo: Bear Williams of Stone Group Laboratories (http://stonegrouplabs.com/wp)
My journey through the world of gemstone authentication taught me that luminescence, in its different forms, is a powerful tool for discriminating real gemstones from their imitations, and for picking out those rare specimens that gain their beautiful color and clarity by natural means. Authentic beauty is a rare thing in today’s world, and well worth preserving.
I am reminded again of Palenque, some 90% of which remains hidden under a post-Mayan jungle. Just as archaeologists work to uncover its intricate beauty, so luminescence allows us to distinguish and truly appreciate the beauty of perfectly formed gems created over millions of years. If you ever visit Palenque, I’m sure you’ll agree that some things just can’t be imitated.
References
1López-Morales, Guadalupe, R. Espinosa-Luna, and Claudio Frausto-Reyes. “Optical characterization of amber of Chiapas.” Revista mexicana de física 60.3 (2014): 217-221.
2Åström, Mikko, Alberto Scarani, and M&A Gemological Instruments. “GemmoRaman-532.” MAGI – M&A Gemological Instruments. N.p., n.d. Web. 21 July 2015.
3del Castillo, H. Calvo, Jose Luis Ruvalcaba, and Tomás Calderón. “Some new trends in the ionoluminescence of minerals.” Analytical and bioanalytical chemistry 387.3 (2007): 869-878.
My first vacation after being hired as an applications engineer at Ocean Optics was to the Yucatán Peninsula of Mexico. Ever intrepid, I convinced my friends to drive south and inland to the 7th century Mayan ruins of Palenque in the Chiapas region. What was supposed to be a 10-hour drive was far longer in our tiny rental car, thanks in part to the speed bumps that graced our passage through each rural town. The effort felt well worth it, however, as we climbed steep temple stairs and wandered through dwellings created and abandoned over a thousand years ago.
So when I recently came across a journal article on optical spectroscopy of amber from the Chiapas region, I was intrigued. I was familiar with Raman spectroscopy for gemstone authentication, but not luminescence – and so a new adventure began. The more I read, the more I discovered that luminescence is a highly complementary technique to Raman in the world of gemstone authentication.
Fluorescence measurements easily distinguish real amber from artificially created resin, while photoluminescence generated during Raman studies can detect dyes used to enhance the color of pearls and coral. Both photoluminescence and ionoluminescence of precious gems like emerald and ruby can be used to discriminate natural stones from artificial. They can even alert gemologists to treatments used to alter the color of natural and artificial diamonds. What’s more, every one of these measurements can be made with an Ocean Optics spectrometer.
Chiapas Amber: Fluorescence Marks the Spot
Image: Courtesy of Cher Fox, a jeweler of custom made rings with Chiapas amber
Though amber is found in several regions in the world, Chiapas amber is prized for its transparency and stunning colors, varying from honey to green, blue, violet and a unique deep red. Harder than amber from the Baltic and other regions, it is ideal for jewelry and carvings. This fossilized resin took millions of years to form, yet is sometimes imitated using artificial resins and glasses.
Figure 1: Fluorescence setup for analysis of amber authenticity.
Investigators at the Centro de Investigaciones en Óptica, A. C. in León, Mexico1 compared false amber to specimens from the Baltic and Chiapas regions, looking at fluorescence excited with a tunable Argon-ion laser at 457, 488, 514 nm and multi-line outputs (Figure 1).
Fluorescence was detected with a USB4000 spectrometer for the Chiapas (Figure 2a) and Baltic amber (Figure 2b), superimposed with the scattered laser light, but no fluorescence was seen for the false amber at all (Figure 2c). Even comparing fluorescence spectra for the true amber, a slight shift in the emission peak could be seen for the Chiapas amber (~525 nm) as compared to the Baltic amber (~535 nm). The researchers found that Raman spectroscopy was also able to distinguish false from true amber, and more clearly distinguish between amber from different regions.
Figure 2a: Chiapas amber
Figure 2b: Baltic amber
Figure 2c: False amber
** Note that the laser power levels used to induce this fluorescence were relatively low, and thus the measurement was non-destructive. “Soft” samples such as amber should be treated carefully when working with lasers, as high fluences can cause physical damage.
Photoluminescence Enhances Raman Spectra of Gems
Raman spectroscopy can be used to quickly and accurately distinguish many imitation or artificially created gemstones. In fact, colorless and near colorless diamonds can be separated from their simulants in less than 0.1 seconds using commercial instruments like the GemmoRaman-5322.
The same 532 nm laser used to excite Raman signal in this type of system also induces photoluminescence of trace elements in the crystal lattice like chromophores and rare earth elements. The photoluminescence may occur in the region above the Raman fingerprint zone, appear as a broad background upon which Raman peaks are superimposed, or even overwhelm the Raman signal entirely. Photoluminescence collected simultaneously with the Raman spectra is extremely valuable, as it can help distinguish synthetic gems from their natural counterparts and be useful in detecting various treatments.
A QE Pro spectrometer configured for Raman spectroscopy has both the sensitivity to collect Raman and photoluminescence spectra, and the resolution to produce detailed spectra for accurate analysis of gemstone composition.
Pearls of a Different Color
These revolutionary cultured pearls are over 90% pearl nacre. See more at: http://www.honora.com/learn-about-honora/freshwater-pearls/#sthash.3MlOEx6V.dpuf
Cultured freshwater pearls get their natural colors from organic pigments called polyenes, which conveniently exhibit enhanced Raman scattering. Dyes can be used to produce colored pearls to simulate the more rare natural specimens; it can be difficult for a gemologist to conclusively rule out their use by visual means. Spectroscopy, however, tells a different story.
Cultured freshwater pearls in their natural state have a broad, consistently-shaped luminescence peak punctuated by Raman peaks attributable to aragonite (a form of calcium carbonate, identified by the green arrows in the left graph below) and the polyene compounds (red arrows), as shown in Figure 3a. Dyed cultured freshwater pearls, in clear contrast, can exhibit a variety of luminescence curves due to the dyeing agents (Figure 3b). While it may not be possible to identify the dyeing agent, photoluminescence-enhanced Raman spectroscopy makes it very easy to identify the use or absence of dyes and validate the value of cultured freshwater pearls.
Figure3a: Cultured Freshwater Pearls (CFWP) in their natural state
Figure 3b: Cultured Freshwater Pearls (CFWP) affected by dyeing
** As noted previously, high laser fluences can cause physical damage to some samples like pearl. The measurements shown above were non-destructive when performed on light colored freshwater pearls, but very dark or black pearls may absorb strongly and sustain damage under testing with Raman spectroscopy.
Protecting Coral and Its Color
Coral comes in a wide variety of shades, from light pink to deep red. While coral itself can be positively identified by looking under a microscope for the characteristic grooves used to transport nutrients, the traditional test for dyed coral requires swabbing with acetone, risking damage to the sample.
Naturally colored coral has distinctive Raman peaks on a characteristic photoluminescence background. The Raman peaks indicate forms of calcium carbonate, as well as the polyacetylenes and carotenoids that imbue coral with such beautiful color. When dyed coral is subjected to the same measurement, a much broader photoluminescence curve is seen (top trace), both centered at a different wavelength and lacking Raman peaks (Figure 4).
Figure 4: Spectral characteristics of natural and dyed corals as measured using Raman spectroscopy
In fact, Raman can also distinguish between endangered Stylaster corals (protected by the Convention on International Trade in Endangered Species) and the more common Corallium corals permitted for legal trade, demonstrating the power of Raman techniques to validate coral value and deter illegal activity involving protected species.
To learn more, visit http://www.gemmoraman.com/Articles/RedCoral.aspx.
Giving Real Emerald the Green Light
Emeralds owe their stunning deep green color to the presence of chromium (Cr3+) and vanadium (V3+) ions in a beryl crystal matrix. Both natural and synthetic emerald has the same chemical structure, making it difficult to discriminate the two. While emeralds exhibit no distinctive Raman peaks, they do show two Cr3+photoluminescence bands, the exact positions of which are influenced by the presence of other impurities like magnesium, titanium and zinc in the beryl structure. This allows synthetic emerald to be distinguished from the two natural types of emerald, schist and non-schist.
Synthetic emerald also tends to have higher chromium ion concentrations than natural emerald, which results in stronger photoluminescence peaks. Even when a natural emerald owes its color primarily to vanadium ions, the chromium ion concentration is still high enough to exhibit photoluminescence, making this a very effective method to authenticate natural emeralds (Figure 5).
Figure 5: Spectral characteristics of natural and synthetic emeralds
Photoluminescence is a Diamond’s Best Friend
Raman spectroscopy is routinely used to separate natural from CVD-grown synthetic diamonds using the presence or absence of a strong Raman peak at 1332 cm-1. It can be more difficult, however, to identify high-pressure, high-temperature (HPHT) treated diamonds.
HPHT treatment is used to alter near-worthless brown and gray type IIa diamonds to near-colorless by annealing the strain present within the diamond lattice. HPHT-processed diamonds cost 45%-65% less than their untreated counterparts, but are not always labeled as such, creating the potential for fraud.
Photoluminescence peaks obtained in tandem with the Raman spectra of diamonds offer clues as to the use of HPHT treatment. Naturally clear diamonds typically exhibit a number of smaller photoluminescence peaks in the range 530-600 nm (see upper scale on spectrum). HPHT treatment removes most of these peaks, leaving only nitrogen-vacancy peaks at 576 nm and 637 nm in some samples.
Figure 6: HPHT Treated vs. Untreated Diamonds
Ionoluminescence
Ionoluminescence is the generation of luminescence through bombardment of a sample with a high energy particle beam from an accelerator. Excitation energy is in the MeV (milli-electron volt) range, allowing access to higher energy levels to detect impurities or defects in gemstones. As with the photoluminescence measurements described previously, ionoluminescence can be used to discriminate between natural and imitation gemstones including ruby, sapphire and emerald3.
Ruby has long been imitated with red spinel, one of the most famous examples being the “Black Prince Ruby” set in the English crown. Ruby obtains its rich red color from chromium ions (Cr3+), while synthetic spinel also has impurities like manganese (Mn2+). Synthetic spinel has a characteristic ionoluminescence response just above 500 nm indicating the presence of manganese, allowing imitation ruby to be conclusively identified.
Similarly, blue sapphire can be distinguished from blue kyanite, a less expensive substitute. Even though the ionoluminescence spectra of both show evidence of Cr3+ transitions at ~700 nm, authentic blue sapphire has an additional broad peak at 300-400 nm due to the presence of naturally occurring defects. In the case of emerald, both the natural and synthetic stones feature a similar ionoluminescence peak, with that of synthetic emerald being broader and much lower in intensity than that for natural emerald.
Conclusion
Photo: Bear Williams of Stone Group Laboratories (http://stonegrouplabs.com/wp)
My journey through the world of gemstone authentication taught me that luminescence, in its different forms, is a powerful tool for discriminating real gemstones from their imitations, and for picking out those rare specimens that gain their beautiful color and clarity by natural means. Authentic beauty is a rare thing in today’s world, and well worth preserving.
I am reminded again of Palenque, some 90% of which remains hidden under a post-Mayan jungle. Just as archaeologists work to uncover its intricate beauty, so luminescence allows us to distinguish and truly appreciate the beauty of perfectly formed gems created over millions of years. If you ever visit Palenque, I’m sure you’ll agree that some things just can’t be imitated.
References
1López-Morales, Guadalupe, R. Espinosa-Luna, and Claudio Frausto-Reyes. “Optical characterization of amber of Chiapas.” Revista mexicana de física 60.3 (2014): 217-221.
2Åström, Mikko, Alberto Scarani, and M&A Gemological Instruments. “GemmoRaman-532.” MAGI – M&A Gemological Instruments. N.p., n.d. Web. 21 July 2015.
3del Castillo, H. Calvo, Jose Luis Ruvalcaba, and Tomás Calderón. “Some new trends in the ionoluminescence of minerals.” Analytical and bioanalytical chemistry 387.3 (2007): 869-878.
