


Multiplexed error-robust fluorescence in situ hybridisation (MERFISH) is a massively multiplexed single-molecule imaging technology capable of simultaneously measuring the copy number and spatial distribution of hundreds to thousands of target ribonucleic acid (RNA) transcripts in single cells (Figure 1).
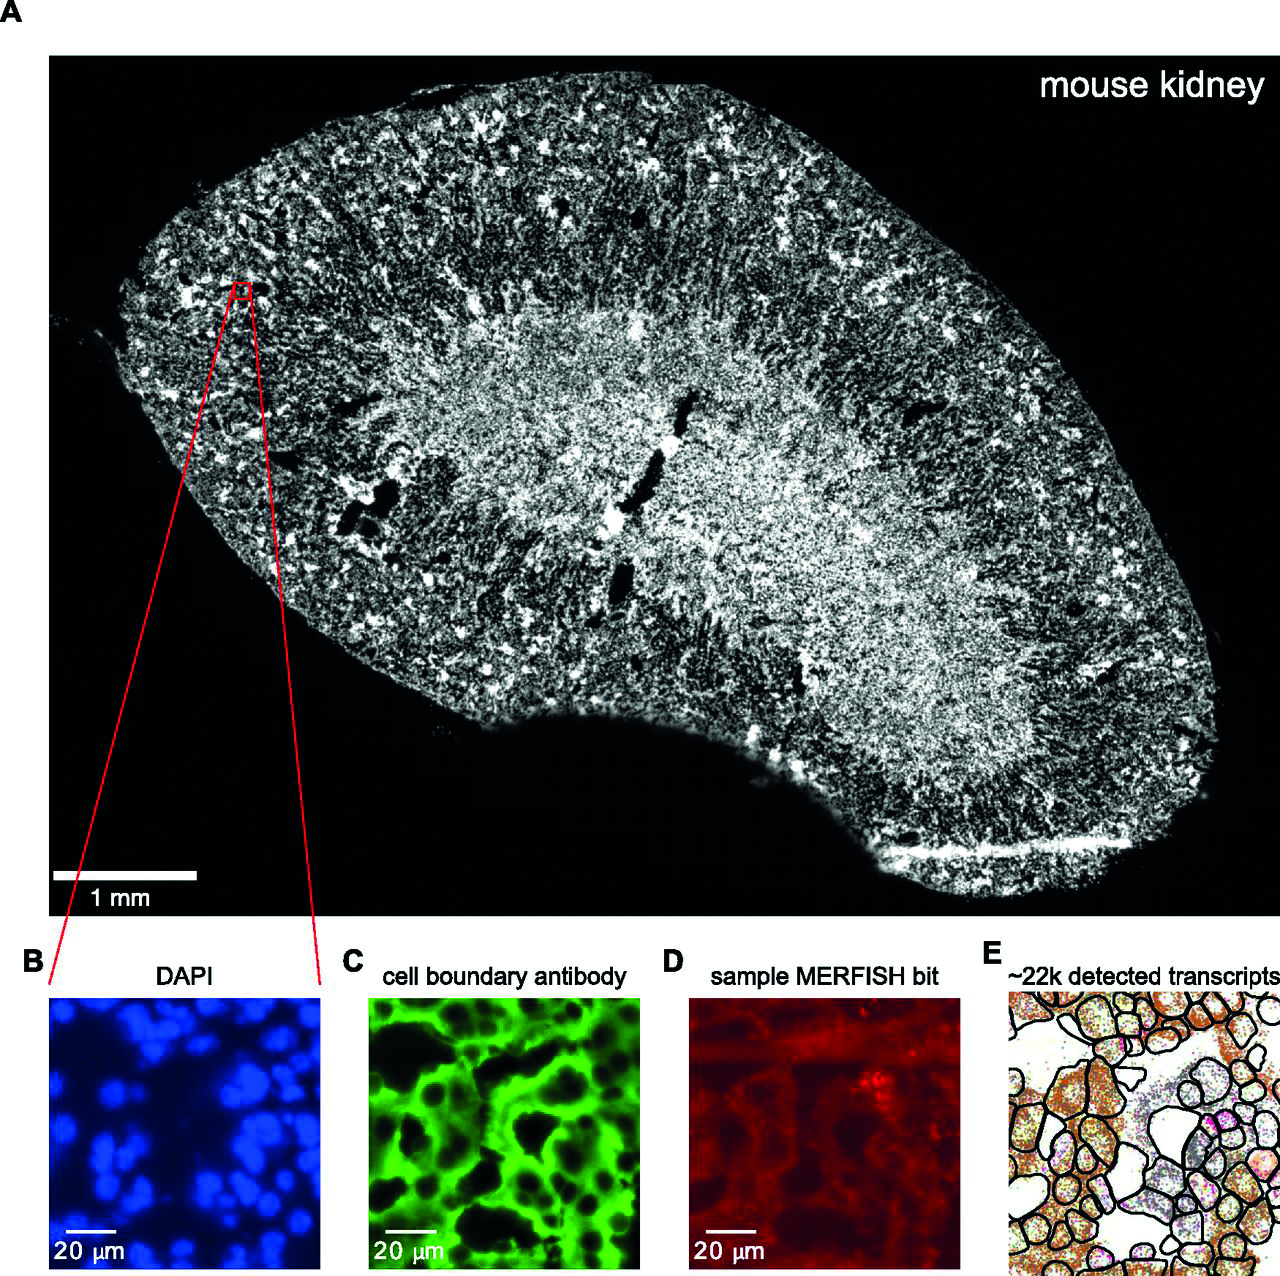
Figure 1: Sample multiplexed error-robust fluorescence in situ hybridisation data acquisition workflow. (A) Low-resolution image of the DAPI channel for a mouse kidney tissue sample. Red box indicates zoomed-in region displayed in B-E. (B, C) DAPI (B) and (C) cell boundary antibody stain channels for the zoomed-in region. (D) Multiplexed error-robust fluorescence in situ hybridisation signal for a single barcode bit channel in the same zoomed-in region. (E) Positions of decoded mRNA transcripts (colourful dots) and segmented cell boundaries (black) in the same zoomed-in region after running data through image analysis pipeline, with each colour representing a unique gene species (Lumencor)
In turn, single-cell transcriptomic characterisation allows in situ identification and spatial mapping of cell types in complex tissues. In MERFISH, RNA targets are identified by hybridising oligonucleotide probes carrying unique encoding sequences. The encoding sequences, and their associated RNA targets, are then identified by iterative optical interrogation.
First, encoding oligonucleotide probes are hybridised to target RNAs. Then fluorescent dye-labelled readout oligonucleotide probes are successively added, spatially localised at the single molecule level and then extinguished.[1, 2] Read-out probes must hybridise exclusively to encoding probes, and not to cellular nucleic acids.
The encoding probe identity is cumulatively deciphered across successive imaging cycles, with binary bit value ‘1’ assigned if the encoding probe is detected by hybridisation of a readout probe, and a ‘0’ value if it is not. In principal, 12 hybridisation+imaging cycles would be required to identify 4095 (212-1) unique encoding probes.
In practice, the binary coding space is underpopulated to minimise false negative (1>0) and false positive (0>1) calling errors and consequent misidentification of target RNAs. For example, identification of 10,050 RNA targets using a 69-bit barcode has been demonstrated.[3] The number of hybridisation+imaging cycles, and therefore the time required to complete data acquisition, can be reduced by simultaneous detection of readout probes with spectrally distinct fluorescent labels in each cycle (e.g. 23 imaging cycles x 3 fluorescent labels = 69 bits).[3]
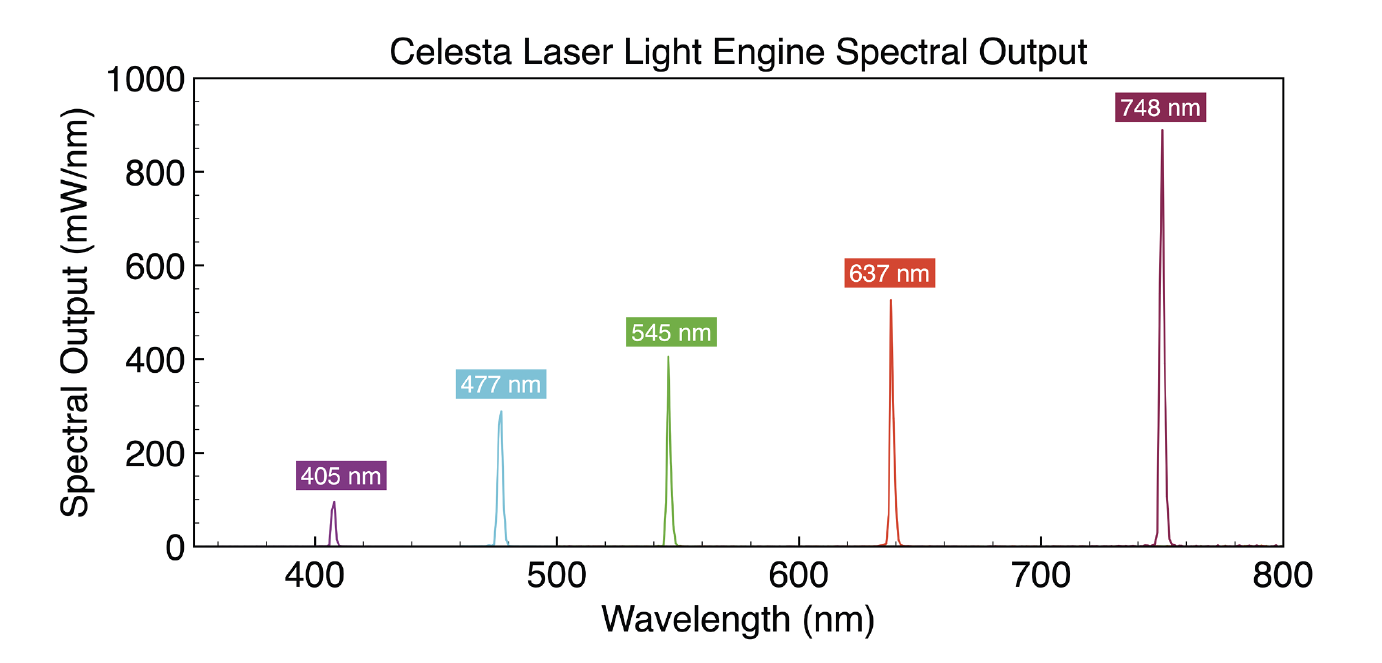
Figure 2: Spectral output of Celesta Light Engine lasers optimised for MERFISH multiplexed single-molecule imaging (Lumencor)
MERFISH imaging requires a high intensity, spatially uniform illumination field matched to the dimensions of typical sCMOS camera sensors, (~200mm2). To meet this requirement, a specialised critical epi illuminator coupled to the fibre output from a Lumencor Celesta Light Engine is installed in the microscope, providing sufficient irradiance at the sample plane via a high magnification objective. The spectral output of the set of Celesta Light Engine lasers, optimised for MERFISH multiplexed single-molecule imaging, are depicted in Figure 2. In typical MERFISH applications, the 477nm, 637nm and 748nm laser outputs of the Celesta Light Engine are used for detecting readout probes.
A sample multiplexed error-robust fluorescence in situ hybridisation data acquisition workflow is depicted in Figure 1. The 405nm Celesta Light Engine laser is used for detecting DAPI and the 545nm output is used for detecting fiducial markers used for spatial registration of adjacent fields of view. The DAPI channel for a mouse kidney tissue sample is represented in a low-resolution image. The red box indicates a zoomed-in region displayed in images B-E. DAPI (B) and (C) shows cell boundary antibody stain channels for the zoomed-in region. Panels B, C, and D show raw images with brightness and contrast levels selected for ease of visualisation.
Multiplexed error robust fluorescence in-situ hybridisation signal, for a single barcode bit channel in the same zoomed-in region, is shown in image E. There it’s possible to identify positions of decoded mRNA transcripts (colourful dots) and segmented cell boundaries (black) in the same zoomed-in region after running data through an image analysis pipeline, with each colour representing a unique gene species. Reproduced1 under CC BY 4.0.
The high-performance laser lighting that Celesta Light Engine provides, in terms of power and wavelength stability, spectral purity, and brightness, is critical to the precise imaging of such large, heterogeneous data samples for spatial biology with MERFISH.
References
[1] J Liu, V Tran, NF Neff et al., Concordance of MERFISH spatial transcriptomics with bulk and single-cell RNA sequencing. Life Sci Alliance (2022) 6:e202201701
[2] JR Moffitt, J Hao, X Zhuang et al., High-throughput single-cell gene-expression profiling with multiplexed error-robust fluorescence in situ hybridization. Proc Natl Acad Sci U S A (2016) 113:11046–11051
[3] C Xia, J Fan, G Emanuel, J Hao, X Zhuang et al., Spatial transcriptome profiling by MERFISH reveals subcellular RNA compartmentalization and cell cycle-dependent gene expression Proc Natl Acad Sci U S A (2019) 116:19490–19499
Further information
For more information about how Lumencor’s Celesta Light Engine is used in life science applications, visit: www.lumencor.com
