Hyperspectral imaging and remote sensing are emerging as key tools for tracking plastic pollution in the world’s oceans. There’s a lot of scientific research using satellite images, and the European Space Agency is supporting a number of remote sensing projects in this area.
Projects like Trace, which uses hyperspectral data from the Italian Space Agency’s Prisma satellite (see the glossary for a list of satellites mentioned in this piece), along with other satellite imagery, to develop a system to track large marine litter and accumulation zones in oceans.
Mathias Bochow, environmental scientist at the Helmholtz Centre, Potsdam, part of the GFZ German Research Centre for Geosciences, is working on the project. He said: ‘While high-resolution, multispectral data enables tracking of floating objects, only hyperspectral data enables material identification. We need to capture a hyperspectral image of a location that allows us to assume where floating litter will be over the next few days to be able to say it is really marine litter and not drifting algae or wood.’
In addition to the Prisma images – and EnMap images once launched – data from multispectral satellites in the PlanetScope constellation were used, alongside the Tiresias oceanographic forecasting model developed by CNR-ISMAR.
Bochow noted the ability to track floating objects has only become possible following the launch of the PlanetScope satellite fleet, which captures images from locations around the Earth every day. Although the fleet is typically only used to obtain images over land and coastal zones, images were recorded over the Adriatic Sea for this project.
‘High frequent imaging over time enables tracking of floating objects when linked with an oceanographic forecasting system. We are about to find out how well this works over the next month,’ said Bochow.
Spectral capabilities in the shortwave infrared (SWIR), between around 1,000nm and 2,500nm, are important for identifying plastics, because of the material’s spectral fingerprint at these wavelengths. According to András Jung, co-founder of spectral camera firm Cubert, hyperspectral imaging can be used to sort plastic at a macroscopic level, such as everyday waste products from household or industry. He said there are many successful applications between 400nm and 1,000nm for this. But hyperspectral imaging can also be used to detect microplastics in water, and in this case the SWIR region is more useful.
Professor Jonathan Chan, ETRO guest professor at the Vrije Universiteit Brussel, noted that the ideal sensor to detect marine plastic should possess more spectral measurement capabilities at SWIR wavelengths.
Chan is working on the Muss2 project, which is using spectral and spatial enhancement methods to generate simulated Earth orbit hyperspectral shortwave infrared images and data from the Copernicus Sentinel 2 satellite using spectral response function modelling.
Hyperspectral images taken from Earth orbit are not always available and their coverage is not as large as conventional missions, such as Landsat and Sentinel. To overcome these limitations, Chan said the Muss2 team will apply a sparse theory-based method to enhance multispectral images from the Sentinel 2 satellite. The expected results are what he described as synthetic Sentinel 2 hyperspectral images at a spatial resolution of 10m, with the same coverage as Sentinel 2 multispectral images.
‘So far, we have been able to generate such images based on Hyperion and Prisma spectral configurations, [and] quantitative assessments are promising,’ he said. ‘In addition, we apply a deep learning-based method for the spatial enhancement of Prisma images to assist in the detection of smaller objects.’
Chan added: ‘All the data inputs for the project are from open sources, including Sentinel 2, Hyperion and Prisma. The launch of Prisma in 2019 was a major milestone, and soon EnMap will be launched. These are full stretch hyperspectral images at 400-2,500nm with hundreds of spectral bands and represent the most powerful Earth orbit data source for environmental monitoring. The potential is not yet fully understood nor exploited, and scientific communities are just beginning to understand all the pre-processing protocols and data quality issues.’
Signed, sealed, delivered
Another interesting initiative is the Spots project, which aims to study the hyperspectral signature of floating plastic debris under less-than-ideal circumstances. As Robin de Vries, geospatial analyst at The Ocean Cleanup non-profit organisation, explained, hyperspectral satellite data has the potential to be a key component in the remote sensing of floating plastic debris.
He said: ‘The hyperspectral signature is affected when plastic is submerged, or when it becomes covered by biological growth over time, known as biofouling. The Spots project is important because many studies have only investigated the detection of floating plastic under ideal conditions.’
The key objectives of the Spots project are to gather a spectral library of different plastics under varying water depth and biofouling scenarios, and to explore predictive models to estimate depth of water, material type and degree of biofouling from the hyperspectral signature.
According to de Vries, the project team has already collected most of the laboratory and field data and, although it is too early to share any definite results, he said the scientists are already finding that material thickness and water depth have profound and sometimes unexpected effects on the hyperspectral signature of plastics.
Throughout the project the Spots team will make use of a range of hyperspectral imaging technology, including a Bayspec OCI-F imager, a Spectral Evolution SR-3501 spectrophotometer, and a Specim IQ snapshot hyperspectral camera.
‘This equipment is only suitable for use in controlled environments,’ de Vries explained. ‘This means that we collect data of plastic in a controlled environment, to learn how we can best extrapolate it to applied remote sensing in the future.’
He added: ‘At this stage, it is challenging to apply multispectral and hyperspectral sensors in the field for applied remote sensing for dispersed marine litter. The main reasons for this are the relatively high cost of the equipment and the limited spatial resolution, as well as the long sensor integration times, compared with a dynamic environment such as flowing rivers or ocean waves.’
Polarised potential
Elsewhere, the Ocean Plastics Polarisation Properties (OP3) project is focused on obtaining fully characterised polarisation signatures of plastic marine litter in relation to other natural seawater constituents. This is through a combination of laboratory experimentation, in situ measurements and existing polarisation data from satellite missions, such as Parasol.
As Tristan Harmel, research scientist at Géosciences Environnement Toulouse, explained, remote sensing of plastic marine litter can be challenging because of the very high water absorption in the NIR-SWIR range, and the signal being masked during atmospheric correction.
Harmel said that complementary optical information is needed to detect plastics in the oceans. The polarisation state of light leaving water has been shown to be a significant tool to disentangle complex marine signals to retrieve water constituents.
To sense the two important elements of polarisation and directionality, Harmel explained that specific setups are needed in the laboratory, as well as in the field and from satellite platforms. For the latter, he said the historical French mission, Parasol, which contained the Polder instrument, was of particular interest because Polder sensors provided polarisation at three spectral bands (blue, red and near infrared) for up to 16 different viewing directions.
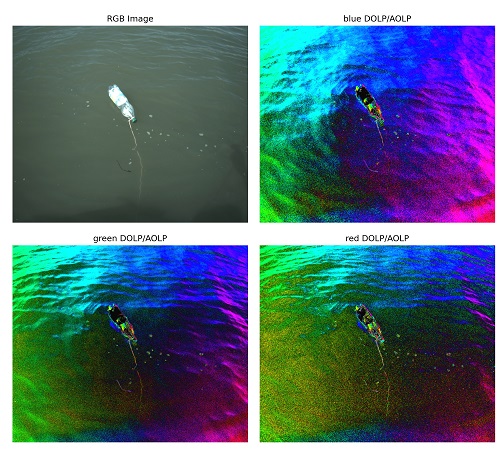
Image from the Ocean Plastics Polarisation Properties project, which aims to characterise polarisation signatures of plastic marine litter. Credit: OP3
Moving forward, he said the next generation of satellite polarimeters will also provide a much more refined dataset encompassing the visible, NIR and SWIR bands. These include the 3MI instrument, to be launched on the Eumetsat Metop-SG series of satellites, which will provide multispectral (410-2,130nm), multi-polarised (-60°, 0°, and +60°) and multi-angular images of outgoing radiance at the top of the atmosphere. In addition, the SpexOne instrument, to be launched on the Nasa Pace platform, will provide polarisation parameters within the spectral range of 350nm to 770nm, with a 10-40nm spectral resolution in five angular directions. The Harp2 instrument, also to be launched on Pace, will provide polarisation parameters for four visible-NIR spectral bands at up to 60 viewing angles.
Harmel said the main limitation for proper implementation of these instruments for plastic litter monitoring is their coarse spatial resolution, which is more than a kilometre. Harmel’s project also investigates using portable or drone polarimeters.
Beyond plastic
Professor Chan noted that it is only a matter of time before the new types of data captured and used as part of plastic marine litter monitoring projects will be disseminated and applied to areas never thought of before.
‘Due to its powerful spectral information, there should be enormous potential. More detailed mapping of land surface materials will be possible and temporal hyperspectral analysis will become more conventional – even though it is a big challenge due to the high dimensionality of the data sets,’ he said.
‘There are already motivations to incorporate such sensors in cubesats to deepen understanding of real-time emissions, temperature and so on. These are very active areas. There will certainly also be new applications related to climate change, green environment and sustainability related topics,’ he added.
Elsewhere, Harmel observed a deeper understanding of the way that light – and polarisation – interacts with plastic in the natural environment is a first step for global monitoring of polluted waters, from lakes and rivers to oceans.
De Vries said it is likely that ongoing research into hyperspectral imaging technology will contribute to the improved atmospheric correction of spectral satellite data over water bodies, which can also benefit other environmental monitoring domains, such as ocean colour sensing.
‘The outcomes of the Spots study and all its data will be made open access, so that industrial parties can also make use of it. I can imagine our library will be useful for industrial waste sorting, in that it could make industrial waste sorting more robust against dirty or wet plastics,’ he remarked.
Jung at Cubert noted that, in terms of the general translation of research moving forward, most of Cubert’s customers are scientists or researchers, but he definitely sees a growing share of OEM or industrial applications.
‘We see potential applications in life sciences – including medicine, agriculture and food – because they need fast and spectrally accurate cameras,’ Jung added. ‘We are good at the identification of randomly moving objects from a randomly moving camera position; this is something which cannot be done by scanners.’
Glossary
- EnMap: Environmental mapping and analysis programme, a German hyperspectral satellite mission set to launch this year.
- Hyperion: a hyperspectral imager (220 channels from visible to SWIR) onboard the Earth-Observing One satellite, which was decommissioned in 2017.
- Landsat: Nasa’s Landsat programme provides the longest continuous space-based record of Earth’s land in existence.
- Metop-SG: Meteorological Operational, Second Generation series of satellites, set to launch over the next two decades. The 3MI instrument, developed by Eumetsat as an improvement on Polder, will be onboard.
- Muss2 project: Multi-model synthetic S2-HS (Sentinel 2-hyperspectral) data for marine-plastic debris characterisation.
- OP3 project: Ocean plastics polarisation properties, led by Carl von Ossietzky Universität Oldenburg.
- Pace satellite: Plankton, aerosol, cloud, ocean, ecosystem. A Nasa mission due to launch in 2023. It will house the SpexOne instrument, a multi-angle polarimeter, as well as the Harp2 polarimeter.
- Parasol microsatellite: Polarisation and anisotropy of reflectances for atmospheric science coupled with observations from a lidar. Launched by French agency CNES to look at how clouds and aerosols impact climate. Contains the Polder instrument: Polarisation and directionality of the Earth's reflectances. The mission ended in 2013.
- PlanetScope: a constellation of approximately 130 satellites, able to image the entire land surface of the Earth every day (a daily collection capacity of 200 million km²/day).
- Prisma: Italian Space Agency medium-resolution hyperspectral imaging mission, launched in 2019.
- Sentinel-2: a constellation of two polar-orbiting satellites housing a multispectral instrument. It is part of the European Earth observation programme, Copernicus, overseen by the European Space Agency. Seven Sentinel missions are in operation.
- Spots project: Spectral properties of submerged and biofouled marine plastic litter.
- Trace project: Detection and tracking of large marine litter based on high-resolution remote sensing time series, machine learning and ocean current modelling.
Sponsored: Gaining an edge when designing a hyperspectral imaging system
Hyperspectral and multispectral imaging techniques were originally developed for military and space applications for aerial imaging.
In recent years, other industries have seen the advantage of these techniques and adopted them, such as quality control inspection in agriculture and semiconductors, DNA sequencing and PCR testing, anti-counterfeiting, emissions monitoring, and traditional machine vision applications in industrial settings – the list goes on.
Hyperspectral imaging is used to capture a wavelength intensity map of a field of view (FOV) with high spatial resolution. This combination of spectral data at each pixel, combined with the corresponding spatial data enables the analysis of a range of characteristics including colour, chemical content and other spectroscopic detail.
Important system components
Most hyperspectral imagers are configured as a scanning ‘push-broom’ imager. This means that for each frame capture, the FOV observed by the system imaging lens is collected through a slit aperture onto or through a diffractive element (grating) and dispersed onto a two-dimensional (2D) sensor array. The axis of the sensor which is congruent with the slit aperture captures the spatial information of the scene, while the spectral information of that scene is collected by the sensor pixel array orthogonal to the slit aperture.
In practice, this push-broom configuration is used to collect data on a moving scene, whether the scene is moving relative to the camera (fixed inspection on parts on a conveyer) or the camera is moving relative to the scene (camera attached to a drone flying above the scene). All of these frames can then be combined to create a hyperspectral ‘data cube’ which contains X and Y (spatial) information on the scene, with a range of spectral data for each X and Y location.
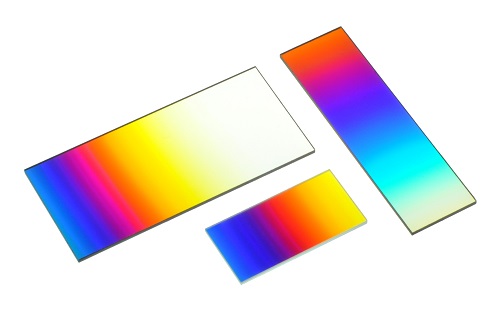
An alternative to the traditional push-broom imaging configuration is to image the scene directly using a 2D sensor array and a linear variable filter (LVF). An LVF is a unique type of interference filter where spectral performance varies along one axis and is constant along the orthogonal axis. It can be a narrow bandpass design, providing spectral discrimination, or a long pass design and used as an order sorting filter in a grating-based spectrometer. In both cases, spectral performance shifts in a consistent manner as a function of spatial position on the filter. The use of a filter to replace the grating or prism in an imaging system results in a significant reduction in weight, size and cost of the imager. High spatial resolution allows for discrimination of fine detail, texture and resolution of a scene.
The design of an imaging system using a linear variable filter requires attention to a number of unique details. The spectral resolution of an LVF camera is limited by the bandwidth of the filter, the operating F-number of the imaging system and the distance between the filter and the detector. Alignment of the filter to the detector array is important in extracting spectral information.
Important Design Considerations
Choosing the right light source is a significant consideration when using an LVF camera. Fluorescent or LED lighting consists of strong spectral bands and therefore solar or incandescent lighting is preferred. An important tradeoff of the LVF camera is that it does not generate a true hyperspectral data cube. The wavelengths in the spectrum correlate to the position of the camera’s LVF/pixel wavelength.
A wavelength versus frame number is created for each pixel, but the spectral scan for each point will potentially contain a different number of points at different wavelength intervals from other points in the image. Nevertheless, the LVF camera images can be stitched together and each point can produce a unique spectrum allowing for identification or characterisation of the object at that point.
Omega Optical Holdings companies Optometrics and Omega Optical have aided countless partners to select the right components to maximise their system performance. Optometrics has the rare combination of manufacturing Ruled, Holographic (reflection and transmission), and replicated gratings which enable the team to recommend a grating from its extensive library which will minimise scatter and maximise efficiency. Omega Optical is a leader in the production of LVFs, and will help partner companies to navigate the trades when selecting LVF bandwidth, gradient, and physical size.
Further information: www.omegafilters.com; www.optometrics.com