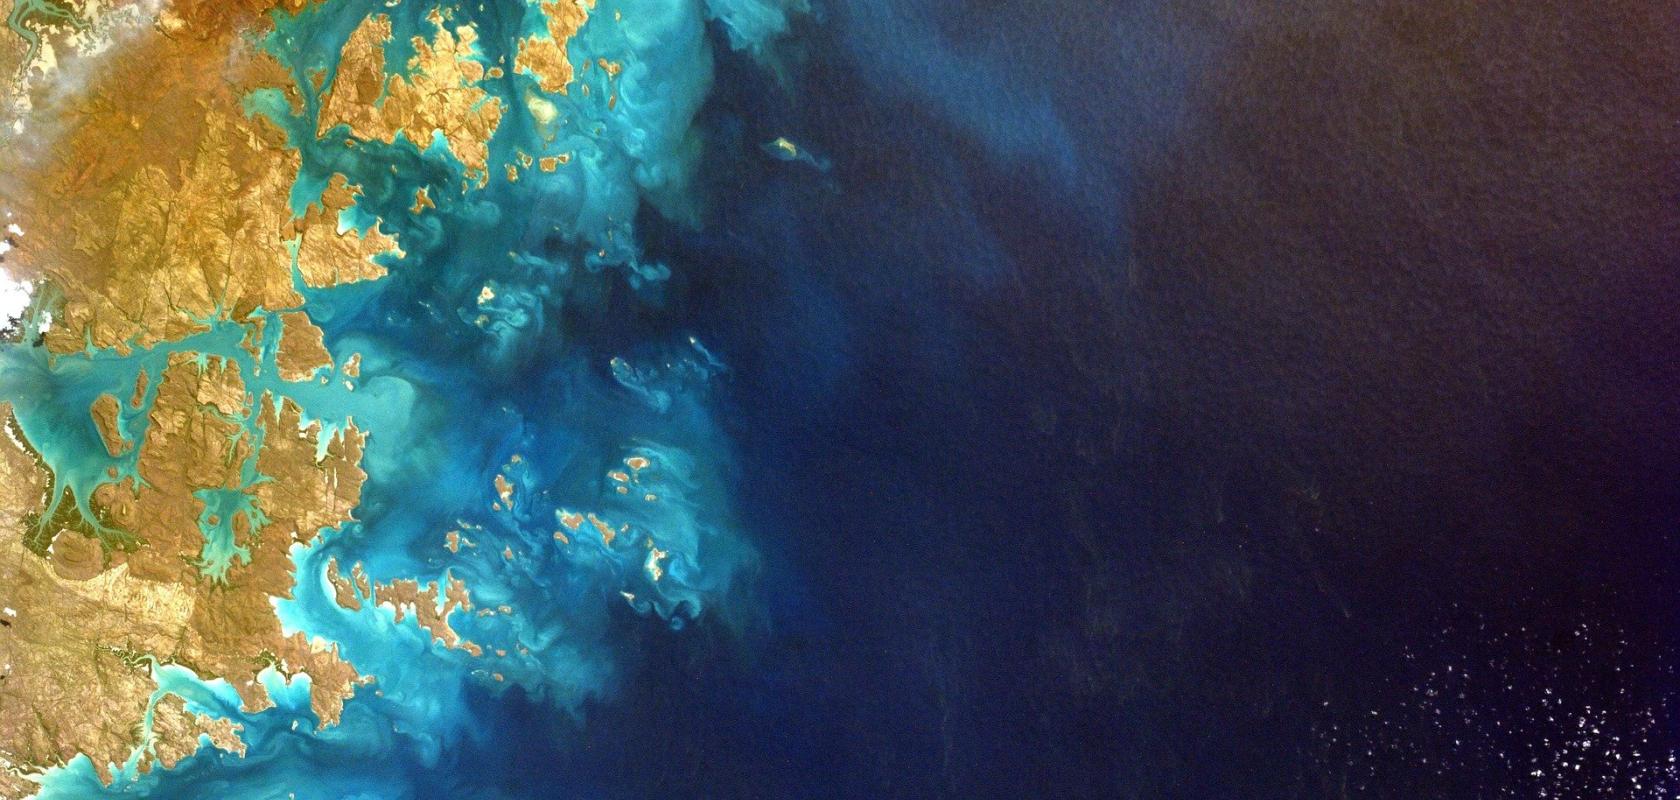
Phytoplankton play a key role in ocean ecosystems, and so monitoring these tiny marine plants enable researchers to answer key questions about ocean health.
Lidar’s potential as a tool to study oceans has ‘huge implications’ for many research areas, according to Jennifer Schulien, who is helping drive the field forward.
Having recently finished a postdoctoral fellowship at Oregon State University, she worked as part of the first research team to use Nasa’s high spectral resolution lidar (HSRL) to measure plankton abundance and production. HSRL’s laser can penetrate deeper into water to return more information than traditional remote sensing methods, which are based on ocean colour and only measure what is happening at the ocean’s surface.
The absence of depth information limits the ability to make predictions, explained Brian Collister, a PhD student in Richard Zimmerman’s team at Old Dominion University, Virginia. Oceanographic lidar remotely measures the depth of plankton and suspended mineral particles.
‘We still do not yet have a full understanding of the response of lidar signals to changes in the optical and biogeochemical properties of marine particles,’ he said. As such, researchers like Schulien, Collister and many others are now working hard to expand what lidar can tell us about the oceans.
Leica Chiroptera 4X integrates a topographic lidar, a bathymetric lidar and a red-green-blue-near-infrared camera
Lidar emits a laser pulse and measures light scattered back to the detector. Perhaps the best-established ocean science lidar application is bathymetry, mapping the sea bed and objects on it. For this, Stockholm-headquartered Hexagon supplies two different lidar products. The first, Leica Chiroptera 4X, integrates one topographic lidar, one bathymetric lidar, and a red-green-blue-near-infrared camera, explains Anders Ekelund, vice-president of bathymetric lidar at the company. The second, Leica Hawkeye 4X, adds another bathymetric lidar designed to collect data from greater depths. Both are intended to be carried on light aircraft or helicopters.
The difference between mapping terrain topographically on land and bathymetrically under the sea is that light interacts with water much more than it does with air, Ekelund noted. Using 1,064nm wavelength lasers, topographic lidars only penetrate a few centimetres into the water. The 515nm wavelength lasers in bathymetric lidars penetrate down to the sea-bed.
On that journey, photons interact with the water surface, molecules and particles in the water volume, objects in water, sea-bed vegetation and seabed itself. ‘A lot of waters around the world are turbid, and therefore systems need to work in those environments,’ Ekelund said. ‘High turbidity may cause you to get so much backscatter from the water, it hides the bathymetric signals.’
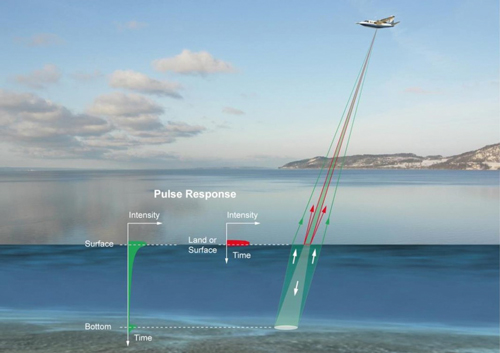
The difference between mapping terrain topographically on land and bathymetrically under the sea is that light interacts with water much more than with air (credit: Hexagon)
In general there is an exponential loss of photons as a function of depth, said Ekelund, described by the diffuse attenuation coefficient for downwelling irradiance, Kd. Meanwhile, the coherent laser beam also diverges exponentially, changing direction and speed as it passes the water surface.
Together, these factors combine to mean that lidar bathymetry can’t resolve small objects at the full depth extinction of the lidar, explained Ekelund. Instead, the Leica lidar survey studio (LSS) software that Hexagon supplies with its lidars analyses the full waveform of laser light returned, classifying the likely origin of scattering. This helps distinguish noise from vegetation or other objects.
Scattering information
Classification data can help map seafloor habitats, although Ekelund noted that this requires research and adaptation to local species and sea-bed types. One of Hexagon’s research partners, at the Nova Scotia Community College (NSCC) in Canada, is now extending the existing classifications to identify the plant eelgrass. ‘By monitoring eelgrass you measure ocean health, and of course it’s an important habitat for fish,’ said Ekelund. The automated classification process the NSCC team has used identifies lidar returns from many different levels in the water, and recognises a specific intensity signal, he added. This enables researchers to distinguish between eelgrass and other seabed terrain.
NSCC also uses a similar approach to quantify the amount of rockweed, a type of seaweed useful as a fertiliser, in the region. ‘They want to have a sustainable harvesting method, so they don’t harvest more rockweed than grows,’ Ekelund explained. Rockweed grows in tidal zones, enabling researchers to estimate biomass using bathymetric lidar when the tide is in. ‘They are not measuring every plant individually, but they have a notion of the area they cover,’ Ekelund said. ‘They also get a measure of the plant height, and plant weight is a function of that.’
While posing a challenge to Hexagon, light attenuation can provide useful information for researchers like Collister and Schulien. They use lidar to count particles in water, and measure how reflective they are, Collister explained. ‘The time required for light to return to the detector can determine the depth, or range, of the reflecting particles,’ he said. ‘As the pulse propagates, light is scattered and absorbed by materials in water that cause the return signal to decay with depth.’ Here Kd provides key information, as it relates to the concentration of materials in the water.
Oceanographers can also get information from how particles change the orientation of linearly polarised laser light when they scatter it. ‘The extent to which this occurs depends on the size, shape, and composition/refractive index of the particle,’ said Collister. ‘The depolarisation ratio refers to the ratio of light that is detected in a new orientation, to light that retains its original orientation. We separate light scattered back to the lidar into these two components using polarising filters.’
Because it does not rely on sunlight like older colour-based methods, lidar can collect data during the day and at night, according to Schulien. Currently, to answer questions on a global scale, researchers use the Cloud-Aerosol Lidar with Orthogonal Polarisation (Caliop) sensor, a joint-venture between Nasa and the French space agency CNES. However, Schulien pointed out that Caliop – carried on the Cloud-Aerosol Lidar and Infrared Pathfinder Satellite Observation (Calipso) satellite – doesn’t measure Kd. She has therefore been using Nasa’s plane-mounted HSRL instrument, which has a more limited range in time and space, but provides more comprehensive data for oceanographers. ‘I can answer more specific questions at finer spatial scales,’ Schulien explained. From HSRL data, Schulien can get Kd and use it to look at a measure of light scattering from particles in the size range that includes phytoplankton, known as bbp.
‘I measured bbp and Kd in the water and demonstrated that HSRL was able to collect accurate measurements down to two optical depths,’ Schulien said, where optical depth is the variable ability of water to block light. ‘Then I used these parameters in a depth-resolved model to show that we can use lidar as a measure of phytoplankton primary production. The applications for using measures of light attenuation and phytoplankton biomass in the ocean are seemingly boundless. For example, bbp with respect to phytoplankton chlorophyll-a can vary physiologically as a response to light or nutrients.’ Schulien has also used lidar depolarisation measurements from HSRL to reveal changes in phytoplankton community composition related to changes in cell shape.
Illuminating bubbles
Damien Josset, an oceanographer at the US Naval Research Laboratory’s Ocean Sciences division in Washington DC, uses lidar to study bubbles, an important component of ocean physics at high wind speed. ‘They are the primary mechanism through which the atmosphere and ocean exchange heat, momentum and gas,’ Josset said. ‘Only a few publications mention the lidar return on bubbles.’ The NRL team has therefore developed a prototype lidar specifically to study bubbles with ‘a lot of promising features’, said Josset. They include a compact scanner/pointing system and dual visible/infrared camera system to help show what the lidar is scanning, and extra feature identification capability.
Depolarisation and the attenuated backscatter coefficient could both help observe bubble clouds in principle, Josset explained. Increase of attenuated backscatter profile when observing bubbles is clear in a controlled setup in a lab, he noted, ‘but in the field, we need polarisation to determine the presence of bubbles,’ Josset said. More complex lidar systems, or combining lidar with cameras, may be able to detect the presence of bubbles without using polarisation, he added.
Josset first used his system in the breaking wave tank in the NRL’s Laboratory for Autonomous Systems Research in Washington DC, and on the research vessel Sikuliaq in the Gulf of Alaska in 2019. More recently he confirmed that everything works well flying in the NRL’s UV-18 Twin Otter aircraft. ‘The airborne lidar is functional and it will perform very well after a few months of additional optimisation in the lab,’ said Josset. ‘The data will be an amazing resource to determine whitecap coverage fraction coincident with the lidar data from Nasa Calipso and echo sounder bubble vertical profiles. I can confirm, without ambiguity, that lidar is the perfect tool to study bubble clouds. It creates a strong depolarisation of the signal, and the scattering properties are such that attenuation is extremely limited. The lidar penetrates the whole depth of the cloud.’
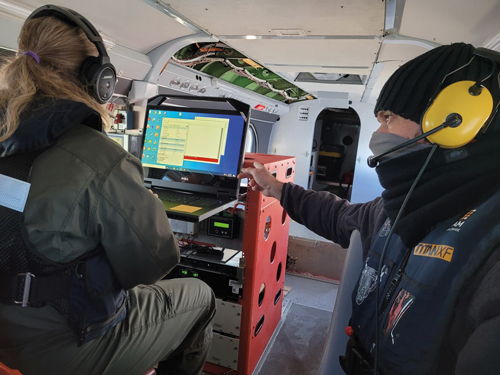
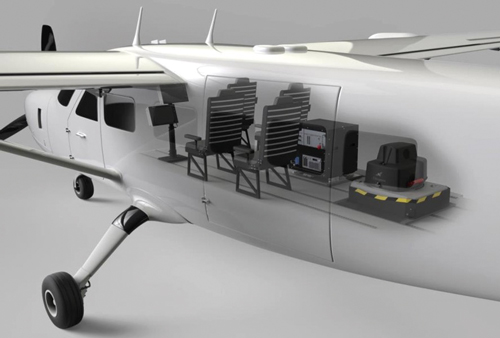
Stephanie Cayula and Damien Josset, of US Naval Research Laboratory’s Ocean Sciences Division, teamed up with Scientific Development Squadron (VXS) 1 to conduct airborne lidar research off the south coast of Alaska in January in a specially modified aircraft (
All the various options for where the lidars are mounted have advantages and limitations for this application, according to Josset. ‘The range of time and space scales covered by the different platforms offers complementarity,’ he explained. ‘Ground-based, underwater and shipborne lidar show the time evolution of the bubble clouds in a given area. The platform moves slowly, while the bubble clouds pass. Aerial and satellite lidar can provide global-scale observations at specific times, and there are typically large spatial differences between each lidar profile. Airborne lidar observations are in-between. The aircraft can cover a large area and our goal for the project was to understand the spatial variability of the bubble clouds at high resolution between the lidar profiles and around the fixed echo sounder profiles.’
From the sea to space
Existing oceanographic lidars are relatively large and expensive airborne systems, said Collister, which the ocean science community has limited access to. As such, the Old Dominion University team designed a relatively inexpensive and compact ship-borne lidar system. It measures profiles of lidar attenuation and depolarisation simultaneously with in-water measurements of particle optical and biogeochemical properties. Collister said that it helps ‘improve our models and develop new understanding of how the laser light interacts with the particles.
‘One of the more interesting things that we are seeing with this new instrument is that lidar measurements of depolarisation have the potential to give us information on the types of particles in the water, not just their concentration,’ he said. ‘This could allow us to better parameterise the role of particles in models of ocean chemistry.’
The Old Dominion team is currently developing a commercial instrument that will be smaller, lighter and provide greater depth penetration and vertical resolution. ‘The portability of this system allows us to move it from vessel to vessel, and even deploy it beneath the water to increase the depth range,’ Collister said. This is beneficial because it can be challenging to validate oceanographic lidar measurements made from air- and spaceborne instruments against ‘in-water measurements that oceanographers really care about,’ he added. ‘The number of matchups between lidar and in-water measurements that we can achieve with this system is unprecedented, and will allow us to rapidly develop lidar techniques that can be scaled up to air- and spaceborne instruments.’
While small systems are convenient, Schulien is keen to see more lidar instruments launched into space. ‘The ability to measure depth-resolved bbp, Kd and depolarisation night and day has implications for so many different areas of research,’ she said. ‘My current research is focused on fish foraging ecology. If an instrument like the HSRL were launched on a satellite, these data could be used for studying fish and could additionally provide valuable data for different areas of ecology-based research.’ However, it’s not yet clear when that hope might be realised.
Such an instrument is not yet planned for a Nasa mission, but researchers are pushing to include it in a European Space Agency payload, Schulien said. For now, Nasa’s Plankton, Aerosol, Cloud, ocean Ecosystem (Pace) mission, to launch next year, will include two passive polarimeters, which are dependent on sunlight, taking a step in that direction.
‘Even though it’s not from an active sensor, I’m really excited about the potential for informing phytoplankton research,’ said Schulien.
Raman spectroscopy at the Tritium Laboratory Karlsruhe
The precise analysis of tritium-containing gases by Raman spectroscopy has become routine and is now used in the Katrin experiment, in process monitoring and control, and in R&D projects
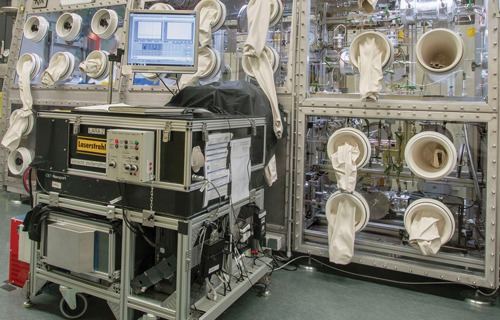
Raman system at the tritium gas-mixing facility
The KArlsruhe TRItium Neutrino mass (Katrin) experiment is one of the flagship experiments at the Karlsruhe Institute for Technology (KIT). Using high resolution spectroscopy of the β-decay kinematics of a molecular, T2-source, Katrin provides a model-independent access to the neutrino-mass scale with a target sensitivity of 0.2 eV (90% CL) after five years of measurement time.
Katrin is hosted at the Tritium Laboratory Karlsruhe (TLK), which provides the full infrastructure for tritium handling, i.e. preparing the required high-purity T2 gas, transporting it for injection into a gaseous tritium source, and recuperating it from the circulation for reprocessing.
T2-gas can never be produced in ultra-pure form as it always contains varying amounts of the other hydrogen isotopologues, at the percent level. Thus, the source gas composition needs to be monitored in real time. In particular, the relative concentrations of the species DT and HT need to be considered in the neutrino mass analysis, due to their impact on the shape and endpoint of the general β-energy spectrum.
Laser Raman spectroscopy – Lara – has been selected as the method of choice for this monitoring task, since first, it constitutes a non-invasive and fast in-line measurement technique; and second, unambiguous identification and, with suitable calibration, quantification for all gas constituents. Within the framework of Katrin, this Lara system has to be extremely reliable and provide high measurement sensitivity for all species concentrations, with the required precision.
The concept of the Katrin Lara monitoring system follows that of traditional Raman spectroscopy of gases, in which the Raman light is collected at a right angle to the laser excitation axis (i.e. 90⁰ scattering geometry). However, the setup had to specifically ascertain that the gas circulation loop of Katrin was not affected, while at the same time augmenting the sensitivity and precision achievable with conventional Lara measurement setups.
In particular, the gas sampling cell had to be compliant with tritium radioactivity requirements, and the optical windows and their coatings needed to be as resistant as possible against β-radiation damage. The cell is mounted in-line in the primary loop for tritium circulation. Consequently, the cell is situated within the tritium loop glove box. Access for laser radiation and Raman light collection is through anti-reflection coated windows in a bespoke 'appendix' extension.
Further modifications to standard Lara systems for gas monitoring include the implementation of double-pass laser excitation; and quantitative Raman light intensity calibration, required for high-precision composition monitoring.
A continuous wave (CW) green (λL = 532 nm) DPSS laser (Laser Quantum, finesse) is utilised in the current Katrin Lara system, with its output power set to PL = 3 W. This laser was selected because it matched the stringent requirements for the Katrin Lara system: measurements needed to be sensitive and repeatable for species concentrations to a level lower than 10-3. The finesse laser met these requirements, with its very high power stability of <0.1% RMS. Note that the finesse pure or axiom would be suitable alternatives; both deliver high power and a very low RMS noise level of 0.03%. Furthermore, the alignment-critical setup of the cell within the glove box benefitted from the excellent long-term laser pointing stability of <2 µrad/⁰C.
The Katrin Lara system is now in nearly constant operation since early 2019, when full operation and neutrino mass data taking commenced.
Individual Katrin measurement runs typically have a duration of up to three months, with short servicing periods in between. During these periods Raman data are taken continuously. Molecular concentrations are extracted from the recorded spectra in real time and transferred to the Katrin database.
An example for such data is shown in the graph (below) for the T2 concentration. The particular data were recorded during the challenging period of late spring 2020, during which the Lara system (and the rest of the Katrin experiment) had to run mostly unattended.
From the graph it is evident that, over time, the T2 concentration slowly changes (and that of the other isotopologues as well). This is a consequence of the dynamic fresh gas feed/used gas extraction in the loop circulation. The sudden jumps are synchronous with new gas batches provided by the TLK T2-processing facility, which may differ in isotopic composition.
During the aforementioned service periods, the finesse laser was checked, and recalibrated, to continue its high level of performance (according to specifications, small drops in laser output power do occur over time). This straightforward recalibration task was carried out by a Laser Quantum engineer, via the remote access link of the laser controller.
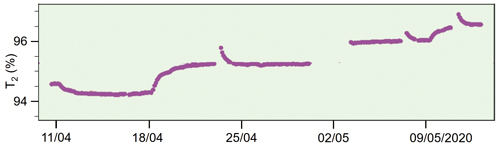
Raman concentration monitoring of T2 during part of a Katrin run
Besides the Katrin Lara system, our Raman group runs further Lara systems, at the TLK and the Universidad Autónoma de Madrid; all incorporate 532 nm models of the Laser Quantum gem and opus series. The systems are used at the tritium transfer facility for batch composition protocols; at the tritium gas-mixing facility; and for tritium gas monitoring and R&D, e.g. to follow the evolution of β-induced reactions generating molecular contaminants. All these applications require reliable laser operation over month(s) at a time.