Light detection and ranging (lidar) technologies are becoming cheaper and more accessible, largely thanks to gains made in the automotive sector. Venture investment in automotive lidar totalled a record $1.3bn in 2019, which has allowed developers to improve the performance of the technology, while reducing its size and cost.
In November Velodyne announced its latest sensor, the Velarray H800 – with a target price of just $500 – which will go into mass production in 2021. For price comparison, the lidar sensors Velodyne supplied to the vehicles that won the Darpa Grand Challenge 13 years ago cost $80,000.
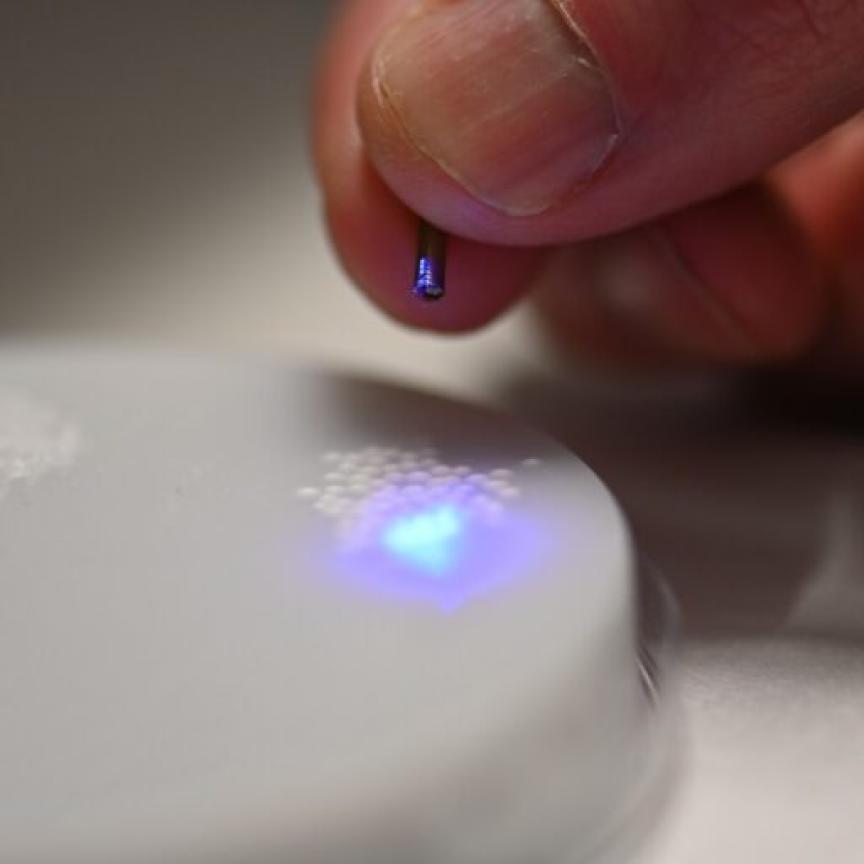
This year, Apple announced a lidar system that was so small it could be integrated into a smartphone. Its iPhone 12 Pro uses single-photon avalanche diodes and vertical cavity surface emitting lasers (VCSELs) to measure reflected light from up to five metres away via direct time-of-flight.
These developments have resulted in scientists having access to a technology that until recently was out of reach due to size and/or price constraints. From mapping animal habitats and migration patterns, to calculating tree carbon storage or the effectiveness of rewilding projects, lidar is helping scientists collect data that either hasn’t been possible before, or at a much faster rate than prior technologies allowed.
Over the last couple of years, lidar sensors have helped scientists map the topology of volcanoes in Hawaii in more detail, and more quickly than existing methods, which is important for predicting future activity in such a rapidly-changing environment.
Modelling topography on active volcanoes poses unique challenges, because dramatic changes can occur on timescales far shorter than a human lifetime. For example, in 2018 at Kīlauea, the most active of the five volcanoes that make up Hawaii, approximately one cubic kilometre of rock volume (0.25 cubic miles) was lost at the volcano’s summit and deposited on the lower East rift zone. So, topographic models can become outdated relatively quickly, which need to be updated accordingly.
In volcano-related cartography and geographic analyses, especially in Hawaii, there is perhaps nothing more important than having an accurate digital model of topography. Such models depict the three-dimensional nature of the land, which elucidate features from past eruptions and help scientists to determine potential pathways of future activity.
Because of the vastness of the areas to be modelled, measuring elevations on the ground using global positioning systems (GPS) is not feasible, except as a verification of other measurement techniques. Therefore, remote sensing – the measurement of ground features from the air – is preferred.
For many decades, aerial photography was the preferred remote sensing technique that the US Geological Survey (USGS) employed in modelling topography. Overlapping aerial photos taken from slightly different positions along a flight line can be viewed to make the observer think they are seeing a three-dimensional scene, rather than a couple of two-dimensional images, similar to how the two human eyes sense depth. Using a large, complicated instrument called a stereoplotter, a user could draw outlines of lava flows and lines of equal elevation, or contour lines, on such a projected scene.
Near the end of the 20th century technologies emerged to replace aerial photography. As such, the last aerial photography surveys to cover the entire island of Hawaii were completed in the early 1980s. Years later, the data were compiled into a digital elevation model (DEM) of the island at 10-metre resolution, which is still being used today.
However, this topographic data did not remain current for very long. When Pu‘u ‘Ō‘ō, a volcanic cone in the eastern rift zone of the Kīlauea volcano, started its eruption in January 1983, it marked the onset of 35 years of near-continuous topographic changes at Kīlauea that reached a climax in 2018. Some reasonably successful remote sensing occurred during this time, most notably a National Oceanic and Atmospheric Administration (NOAA) survey in 2005, but with an ongoing eruption it is inevitable that some of the data will be instantly rendered obsolete.
In the months that followed the 2018 eruption, it became clear that the pause in eruptive activity might be an opportunity to finally update the topography for Kīlauea. Accordingly, a lidar survey was planned and completed in July 2019. A laser pulsing instrument was flown over the landscape on a helicopter, with a sensor measuring the return times for each light pulse depending on the distance from instrument to target. The surveys covered 219 square miles (567km2) and included Kīlauea Volcano’s summit, lower east rift zone, and middle east rift zone (including the entire Pu‘u ‘Ō‘ō lava flow field active from 1983 through to early 2018).
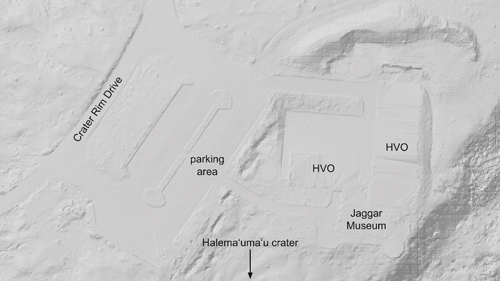
A sample of the digital elevation model from the 2019 lidar survey of Kīlauea. The buildings have been digitally ‘flattened’ because light pulses are not able to penetrate structures; this flattening approximates the ‘bare earth’ ground surface below the buildings. Lidar data captures minute details, such as the elevated curbs in the parking area. Credit: USGS
The raw dataset that results from a lidar survey is a point cloud. All objects that reflected a light wave are depicted, including vegetation, structures and the ground. The ‘first returns’ in forested areas often depict the tree canopy, and sometimes these data are useful to environmental scientists, but geologists are most interested in the last or ‘bare earth’ returns.
To make a useful DEM from the point cloud, a filter is applied to exclude all but the bare earth points, then elevation values are calculated from the points for each cell in a grid – most often by averaging. The DEM from the 2019 Kīlauea lidar has one-metre grid cells with calculated elevations that should be accurate to approximately 10cm. The data were verified by comparing with GPS ground control points surveyed in spring 2019.
With a reliable topographic model for Kīlauea now available, the USGS Hawaiian Volcano Observatory can merge this data with existing models that still reliably depict other areas to make a new three-dimensional model for all of the Island of Hawaii. The dataset is being used by Hawaii Volcanoes National Park and Hawaii county; it will be incorporated into various maps, and enable more accurate projections of lava flow directions in the future.
This dataset will be up-to-date until the moment lava starts erupting once more, then the whole process will likely repeat itself. However, with lidar providing the speed and detail this application requires, it’s a significant improvement on previous methods.
Ash clouds
Lidar instruments are also helping to improve the detection, and aid the forecasting of, volcanic ash.
Earlier this year, additional monitoring equipment was installed near the Reykjanes volcano in Iceland, where scientists suspected magma may be accumulating underneath the surface, to better monitor developments. A lidar instrument was included, intended for measuring volcanic ash in the air. It would be important when determining whether airports can remain open should an incident occur. Volcanic ash consists of fragments of pulverised rock, minerals and volcanic glass, which can be spewed tens of thousands of feet into the air, reaching jet cruising altitude. The ash can have disastrous effects on jet engines, leading to many flights being cancelled following volcanic eruptions.
A few years after the 2010 Eyjafjallajökull volcanic eruption in Iceland, 10 lidar systems were installed across the UK to help minimise the kind of disruption and safety issues that followed the 2010 eruption, which affected hundreds of thousands of passengers across the globe.
The network of ten lidar sensors designed to sense atmospheric particles around the UK, was part of a £3m project funded by the UK’s Department for Transport.
Designed by Raymetrics, a manufacturer of backscatter, Raman and depolarisation lidars for atmospheric analysis, the instruments send observations to the UK’s Volcanic Ash Advisory Centre, to provide more detailed information on the location and characteristics of ash that could impact flight paths.
This information supports improved forecasts on the dispersion of ash, to ensure the safety of travellers and minimise any potential disruption, such as that caused by the Eyjafjallajökull volcano in 2010.
The ash from its eruption led to the one of the largest air-traffic shutdowns on record.
‘The 2010 volcanic ash cloud led to flights being grounded for days at a time, not just here in the UK but across Europe and further afield, with knock-on effects on international airports around the globe. It had a significant impact on travellers, the aviation industry, and wider economy,’ explained the UK’s aviation minister Robert Goodwill.
The equipment allows the UK’s Met Office ‘to track ash clouds more easily and predict how they might spread more accurately. That could play a big part in minimising disruption to flights during any future incident,’ Goodwill continued.
The lidar devices probe the atmosphere using light from a pulsed laser source. Backscattered light from suspended aerosols is collected using a receiver (telescope) and analysed.
The information obtained through this method helps agencies build a profile of the vertical distribution and characteristics of particles in the atmosphere. Each unit will be collocated with a sun photometer to support ongoing research into more accurate and timely estimates of particle concentration levels.
Used in conjunction with data from satellites and other ash-detection capabilities, such as the Met Office Civil Contingency Aircraft, the information provides experts at the Met Office with the best possible picture of real-time ash distribution.
During the 2010 incident, a network of older laser-based equipment, originally set up to measure cloud heights, was reconfigured for ash observations. The new lidar network will be more advanced and include the capability to distinguish ash from other types of aerosols.
On the road to self-driving cars: my car and how it sees the world
Lidar technology is enhancing the automobile in all ways possible
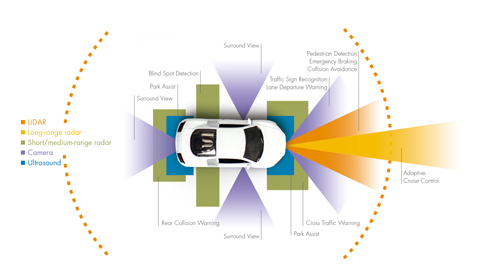
In the world of science fiction, self-driving cars are practically standard vehicles. In ‘real life’ we are catching up fast with authors’ imaginations. Whenever this automotive future begins, vehicle-environment sensing will play a major role in achieving this next step, because in order to independently steer through traffic, the vehicle must always be able to keep an eye on its surroundings.
A bat in the car?
Locating objects and navigating by ultrasound has been seen before in nature, by bats, which emit ultrasonic waves and can recognise prey and obstacles by means of a reflected echo. Artificially generated sound waves have a comparatively short range; therefore, they can only be used at close range.
The first models with this assistance system came onto the market in the early 1980s. Ultrasonic technology is now not only used at the rear of the car, but also with blind spot sensors, or to measure the distance to the vehicle ahead at low speeds as well.
A car with eyes
Camera systems probably come closest to imitating human perception. Software interprets the data to identify edges that might mean other vehicles or lane markings, as well as traffic signs or traffic lights. This information helps to prevent accidents and contributes to orientation, because the camera also recognises details that are not recorded on the digital maps of common navigation systems.
There are two main problems with camera-based systems – the lack of three-dimensionality and the limited viewing angle. A single camera reduces the three-dimensional world to two dimensions. In an environment like street traffic, where there is a lot of movement, this can lead to a misinterpretation of data. Field of view and 3D perception can be overcome by using several cameras simultaneously, possibly with different focal lengths.
Radar or lidar?
Radar and lidar do not just happen to have similar names. They are both used in detection and ranging. Like ultrasonic detection, they are based on the analysis of reflected waves – except that in one case the waves are radio waves and in the other case light waves.
Frequency-modulated continuous wave radars, in which the frequency of the electromagnetic wave is constantly modulated in the form of a ramp, are commonly used in environment recognition. Using the doppler effect, the distance and speed of an object can be determined from the propagation time of the wave and the frequency difference of the reflected wave. However, radar does not provide any information about the size or shape of an object.
Lidar measurements use several thousand nanosecond laser pulses per second. The distance to the obstacle can be determined by the difference in transit time between the outgoing signal and the incoming reflection, the so-called time of flight (ToF).
Sensor arrays are used to monitor larger areas. The Fraunhofer Institute for Microelectronic Circuits and Systems (IMS) has recently even developed a chip that allows lidar measurements without moving elements. Using the measurement points, a computer calculates a detailed three-dimensional image of the surroundings.
The lidar method, therefore, works considerably faster than the radar method and provides a greater amount of more precise data. Light attenuation by fog or humidity can limit lidar to shorter ranges. For longer distances car manufacturers have traditionally relied on long-range radars in the 77GHz frequency range.
Strength in numbers
While a human can intuitively draw on his or her wealth of experience and intuitively react to situations, a computer must constantly make new decisions. To do this, it needs as much data as possible. Each sensor system can contribute to this decision with its specific advantages and disadvantages.
Transmitter and receiver from a single source
Lidar systems need to be reliable, small and cost-effective at the same time. For manufacturers of laser-based measuring devices and optoelectronic components, this is a great challenge.
Laser Components manufactures all components for powerful and future-oriented lidar solutions in its ISO-certified production facilities. Pulsed laser diodes with ultra-short pulses provide better resolution for distance measurement. In combination with highly-sensitive avalanche photodiodes (APDs), even the smallest signals can be detected.
In addition, there is a co-operation with the Fraunhofer Institute for Microelectronic Circuits and Systems (IMS) for one-dimensional and two-dimensional CMOS-SPAD arrays. The researchers from Duisburg can contribute new sensor technologies that promise particularly precise measurements.